







Description
This study focuses on air pollution in Makassar City, which is largely caused by motor vehicle emissions. The growth in the number of motor vehicles, which reached more than 2 million units in 2024, has led to high levels of particulate matter (PM₁₀) in the ambient air, which has a direct impact on public health.
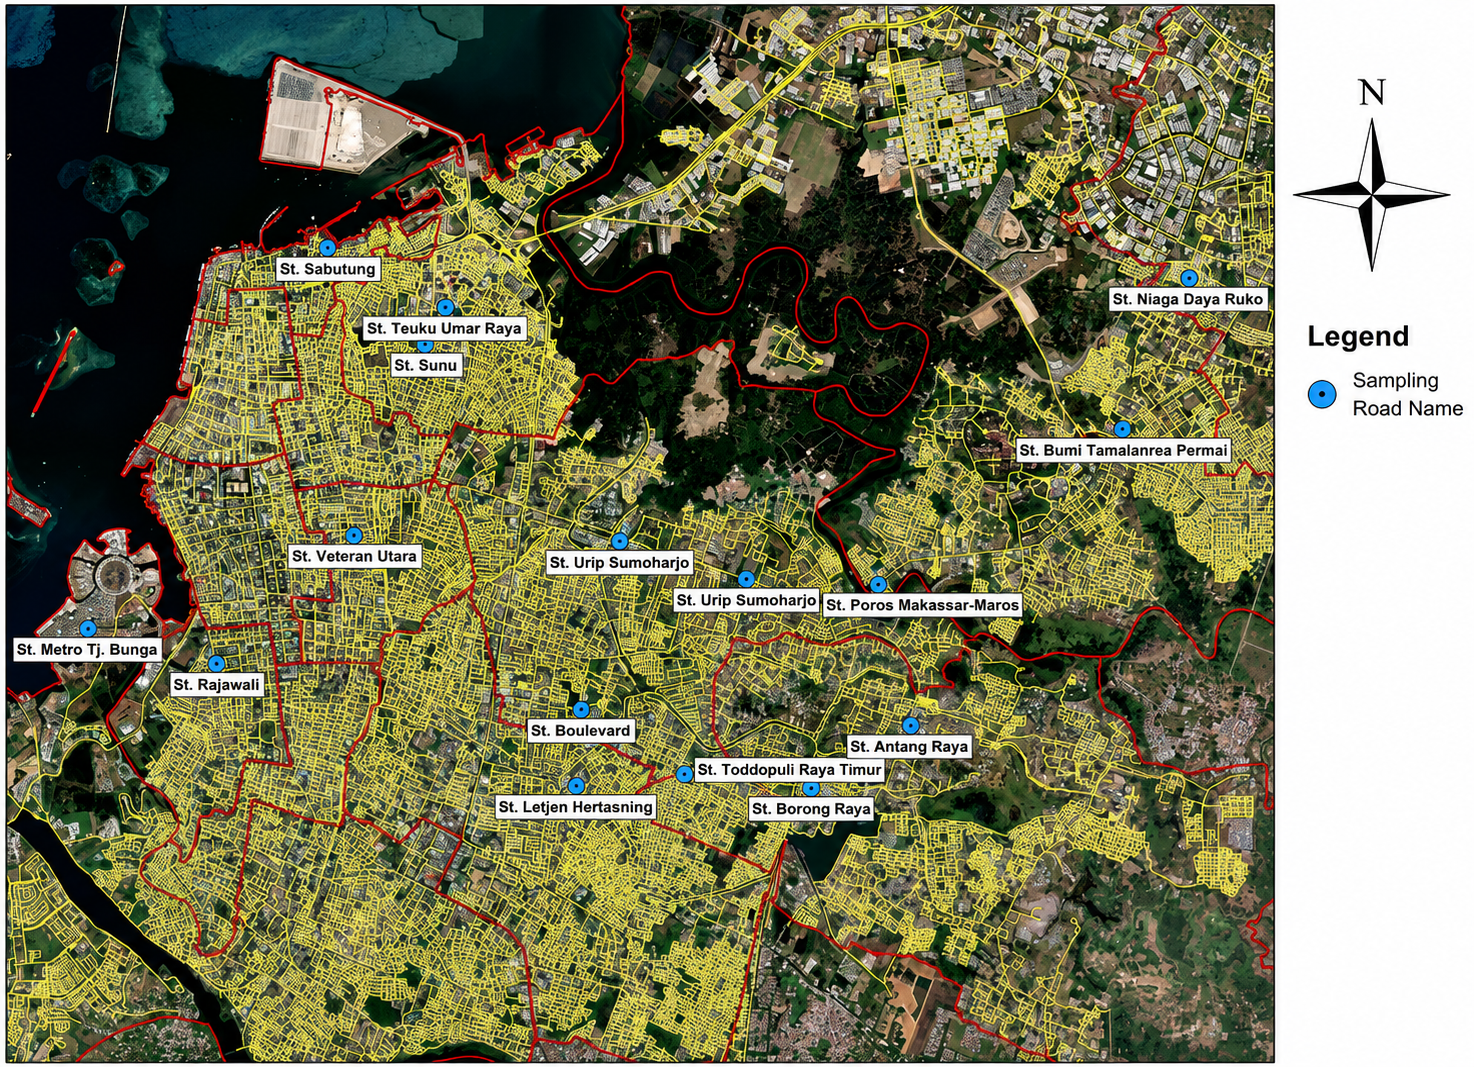
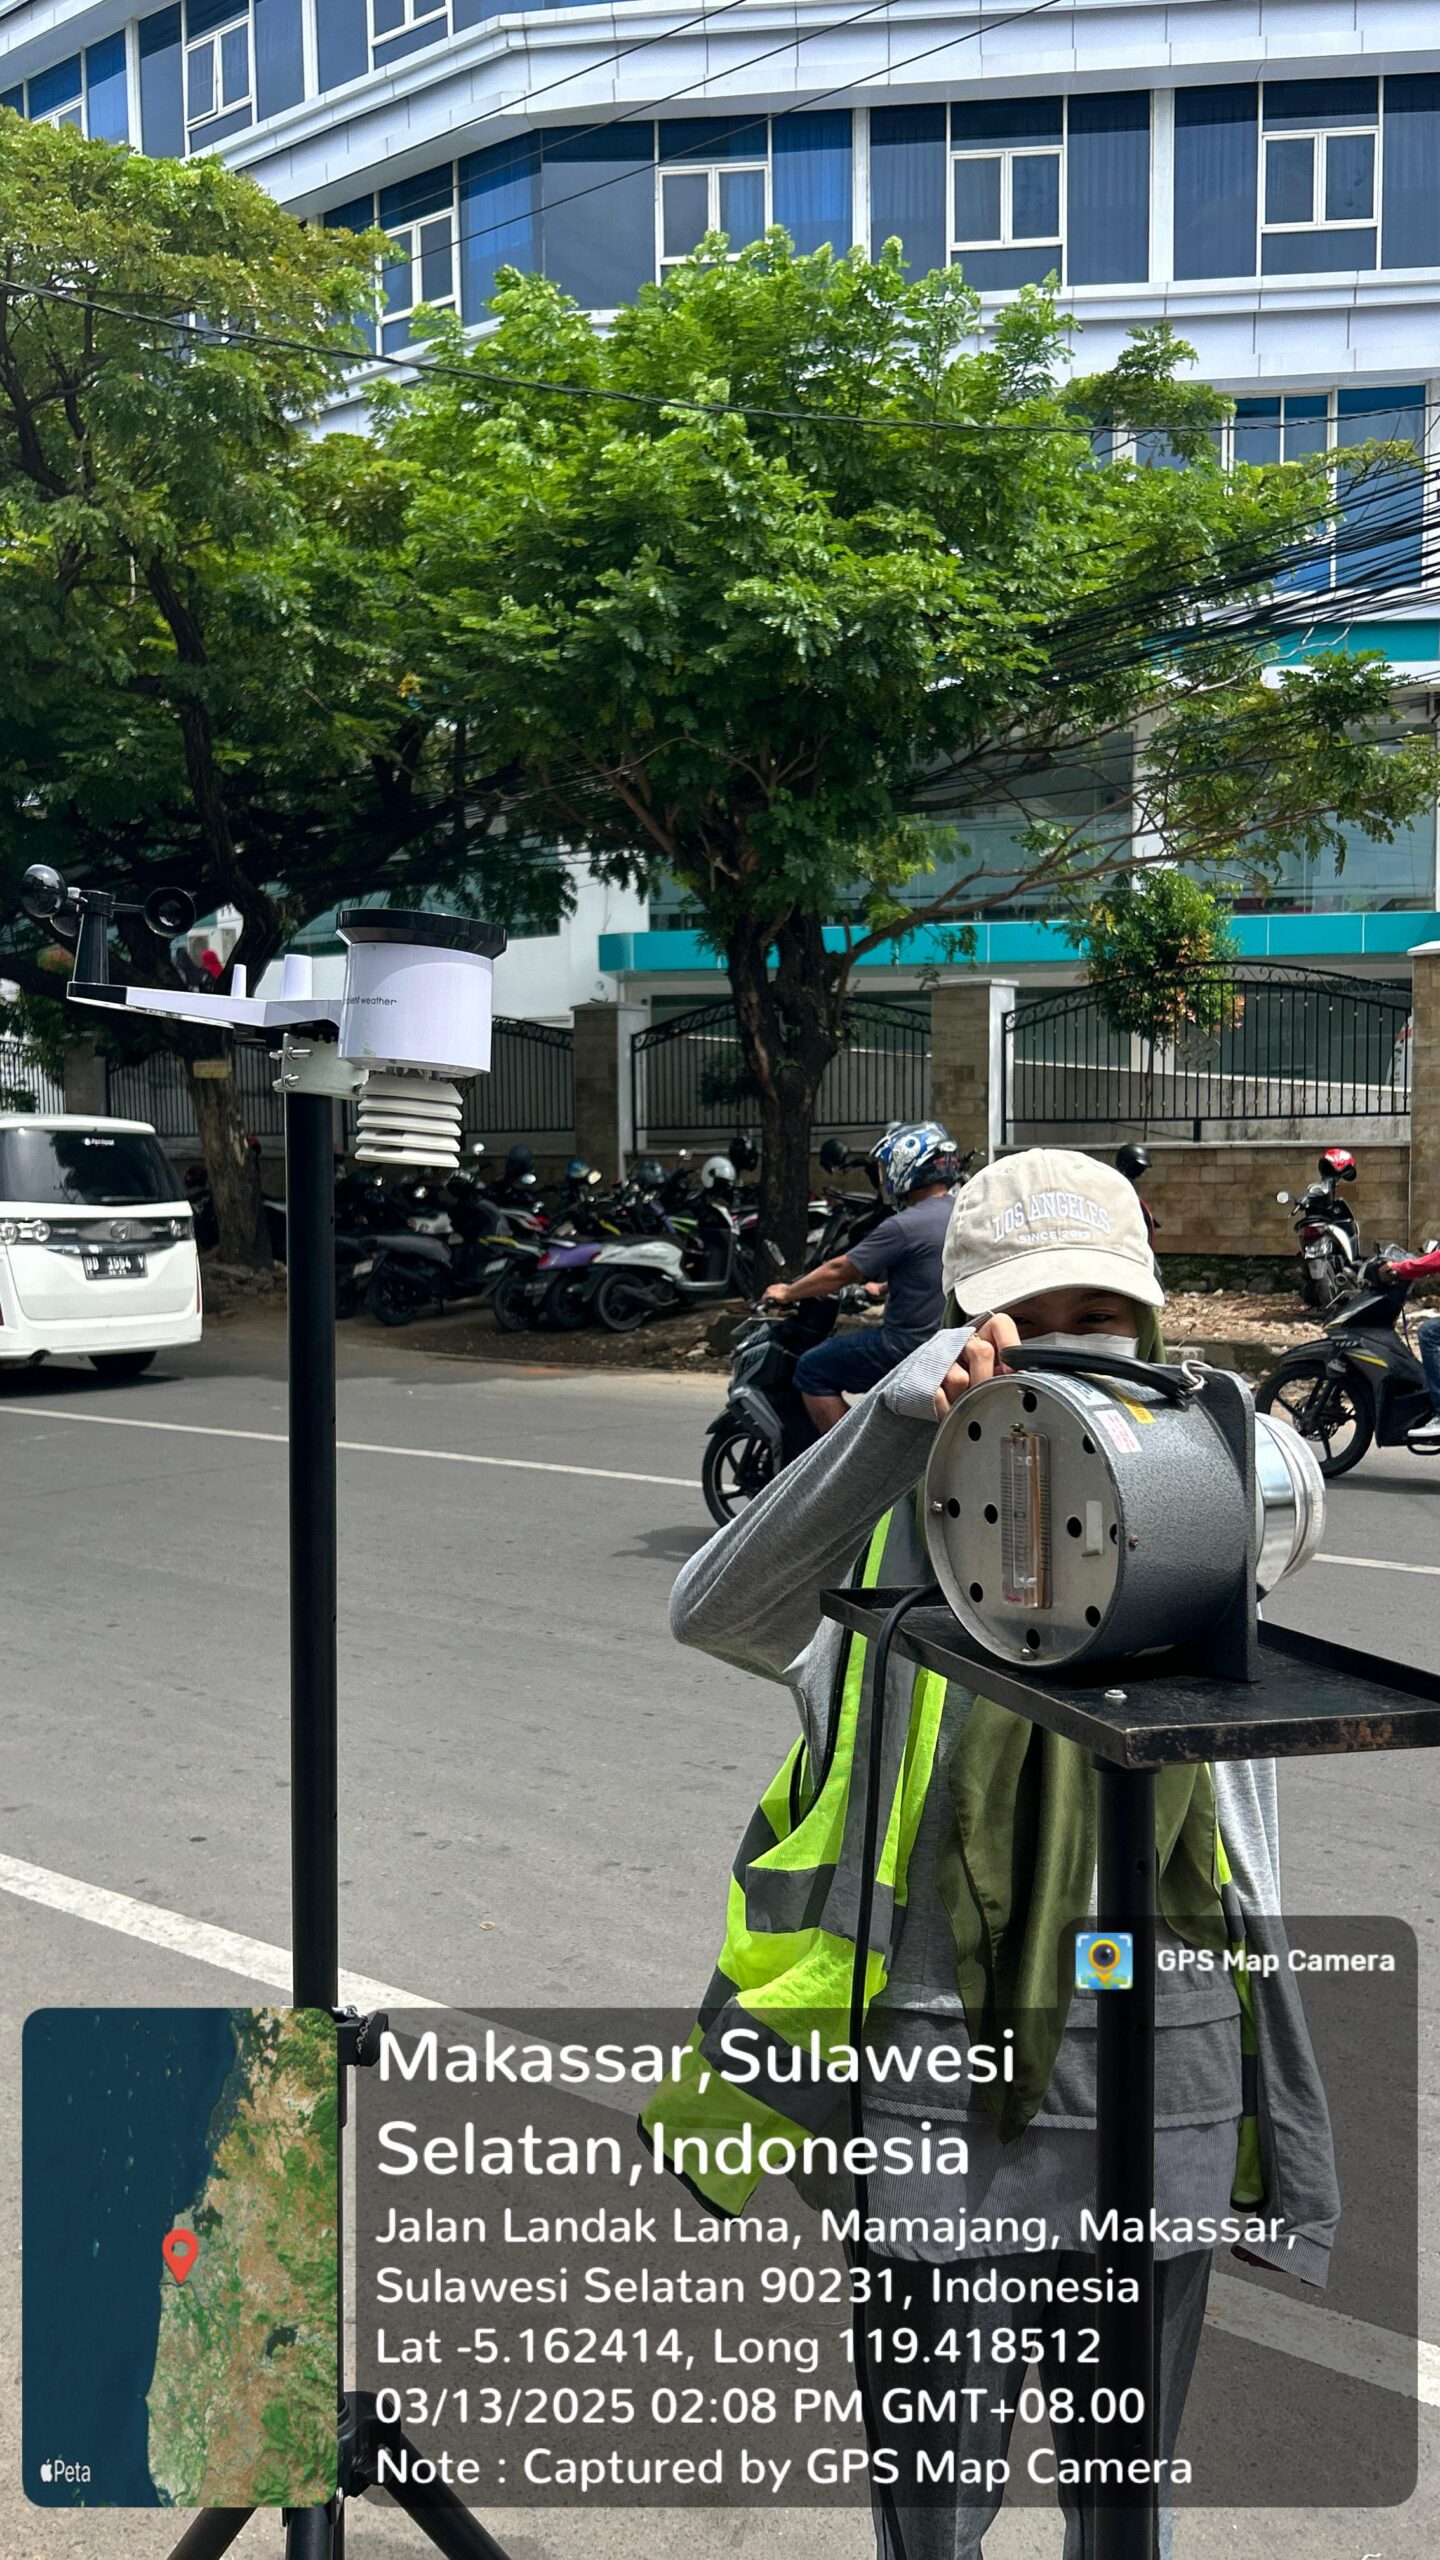
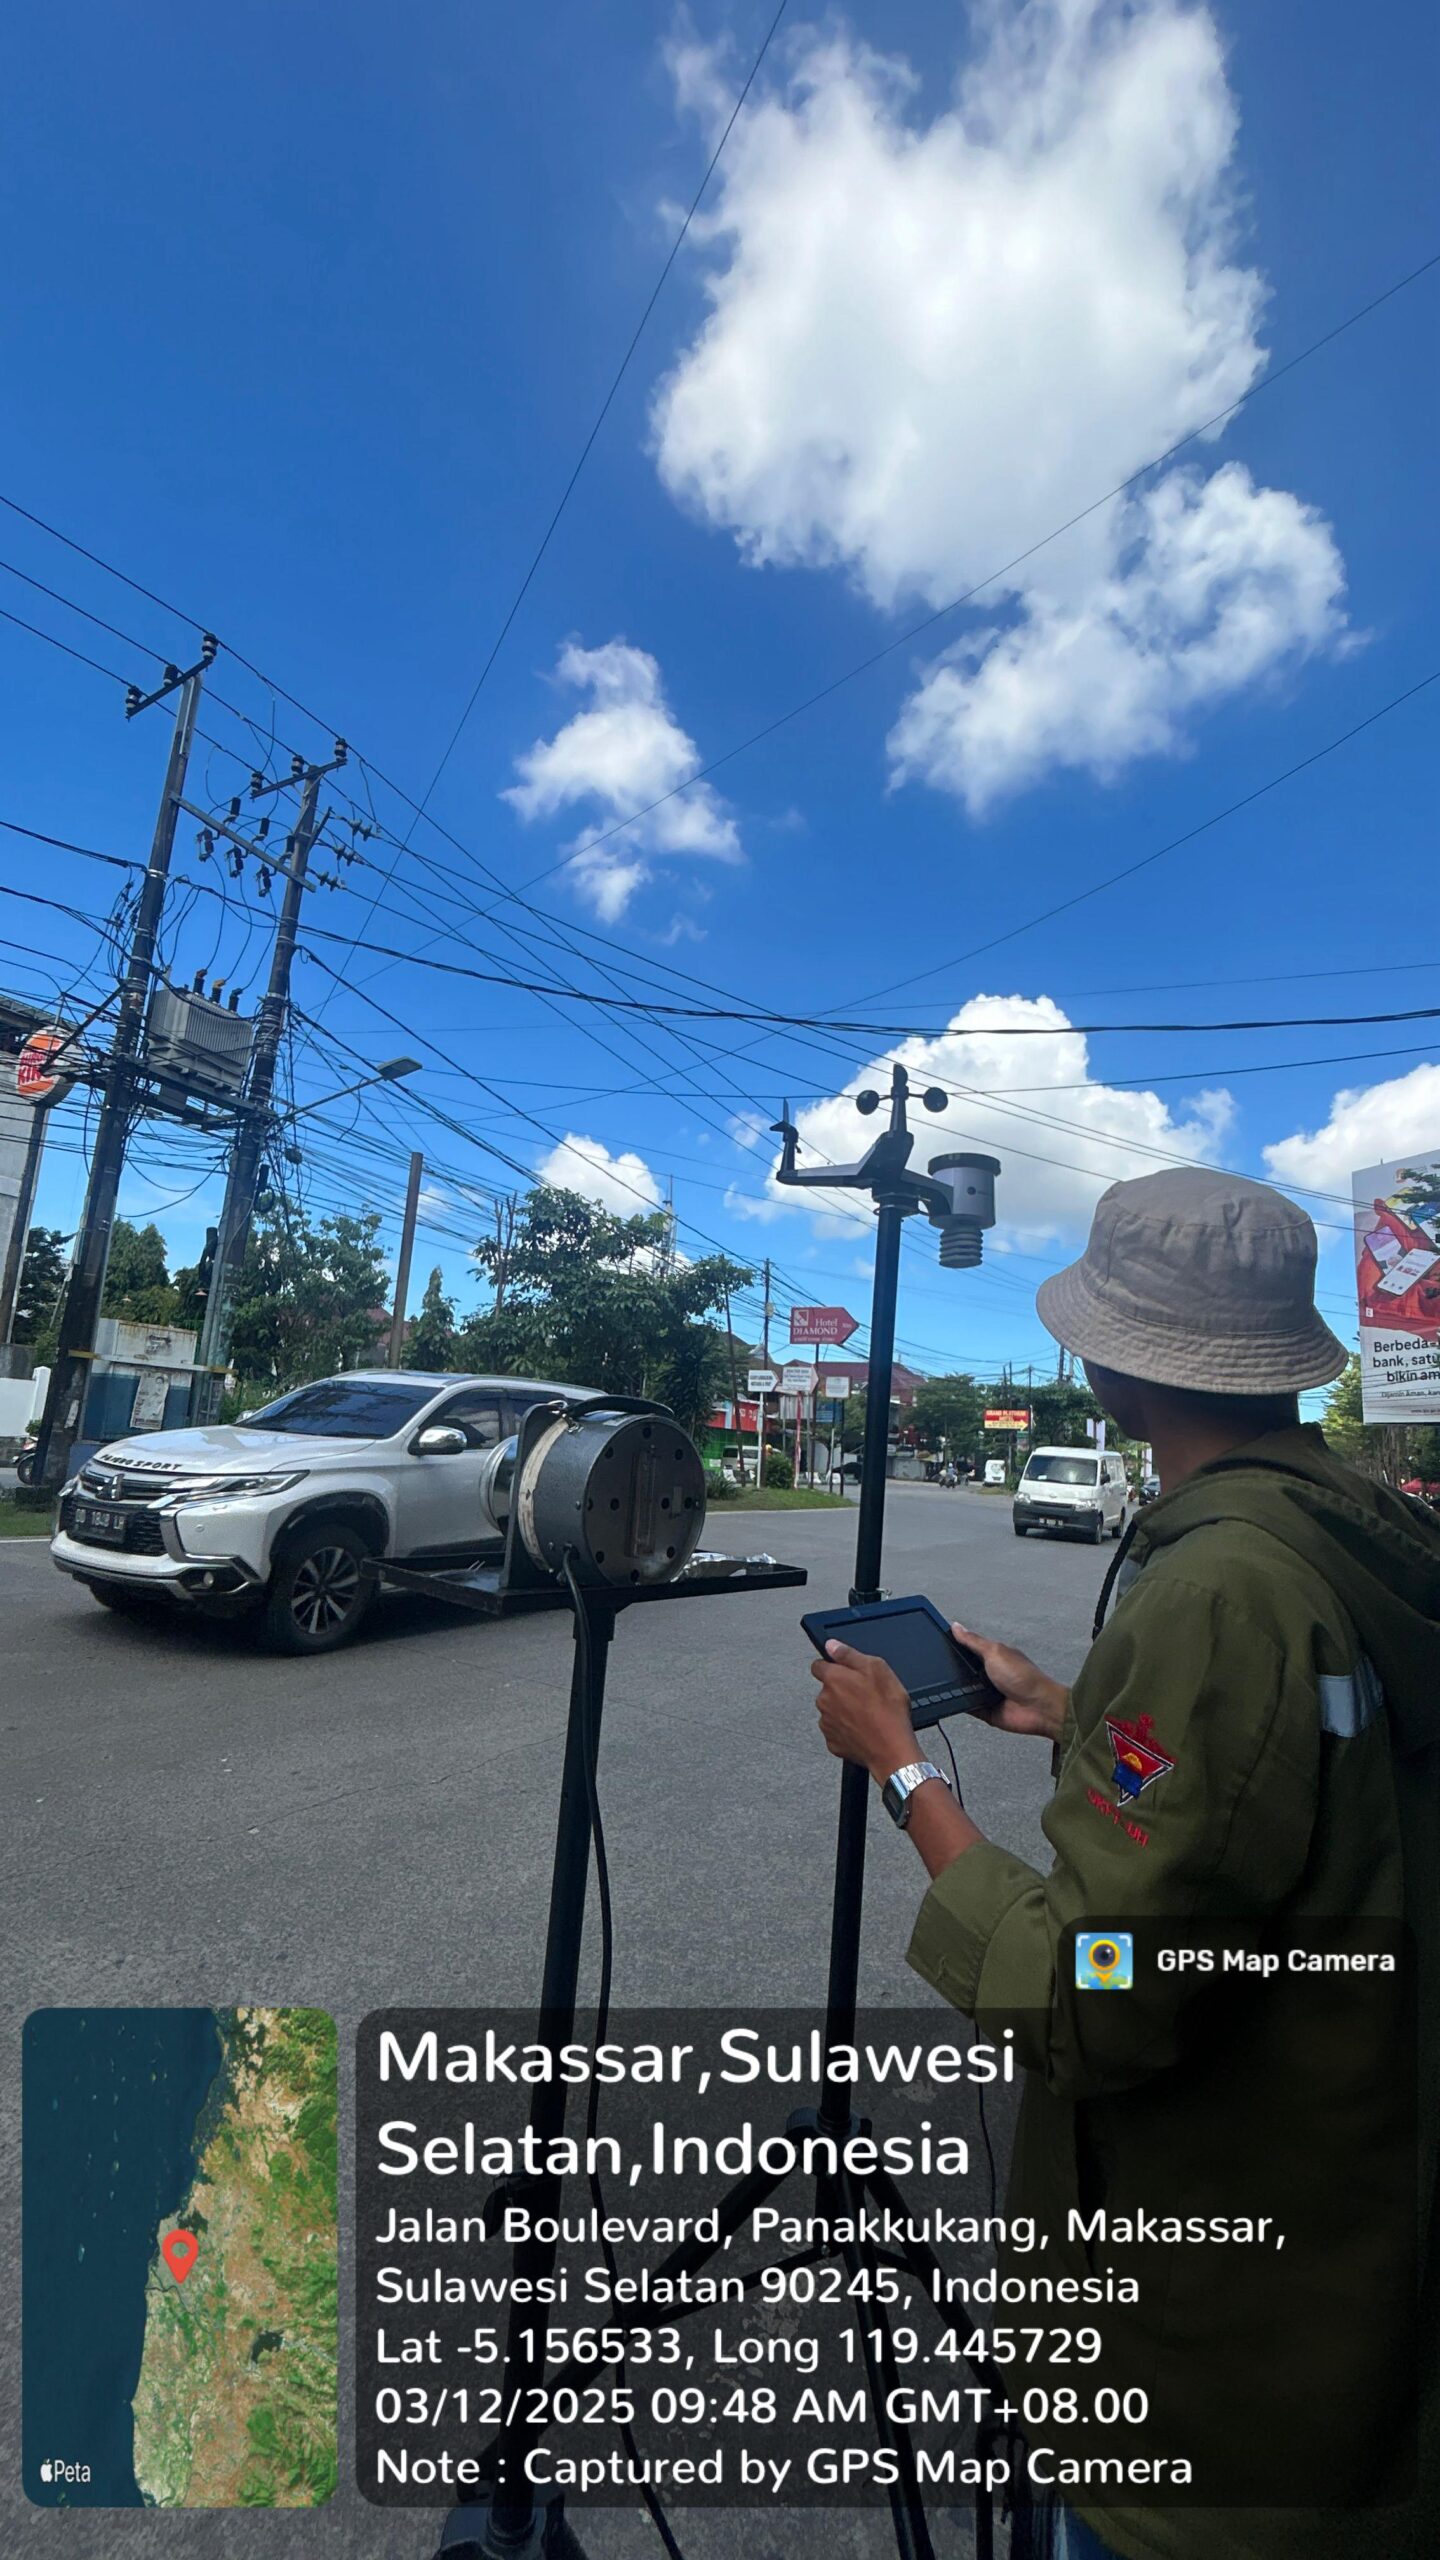
The research was conducted by measuring PM₁₀ concentrations at 30 locations in Makassar City using a High Volume Air Sampler (HVAS) for 15 days, with four time intervals (morning, afternoon, evening, and night). In addition, vehicle volume was also calculated based on type (motorcycles, light vehicles, and heavy vehicles). Secondary data in the form of meteorological parameters were obtained from Climate Copernicus. The analysis was continued with emission load calculations using the Tier-2 method based on vehicle emission factors, as well as pollutant dispersion modeling using AERMOD software.
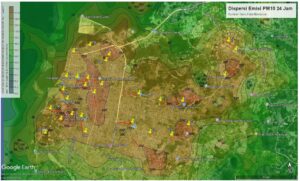
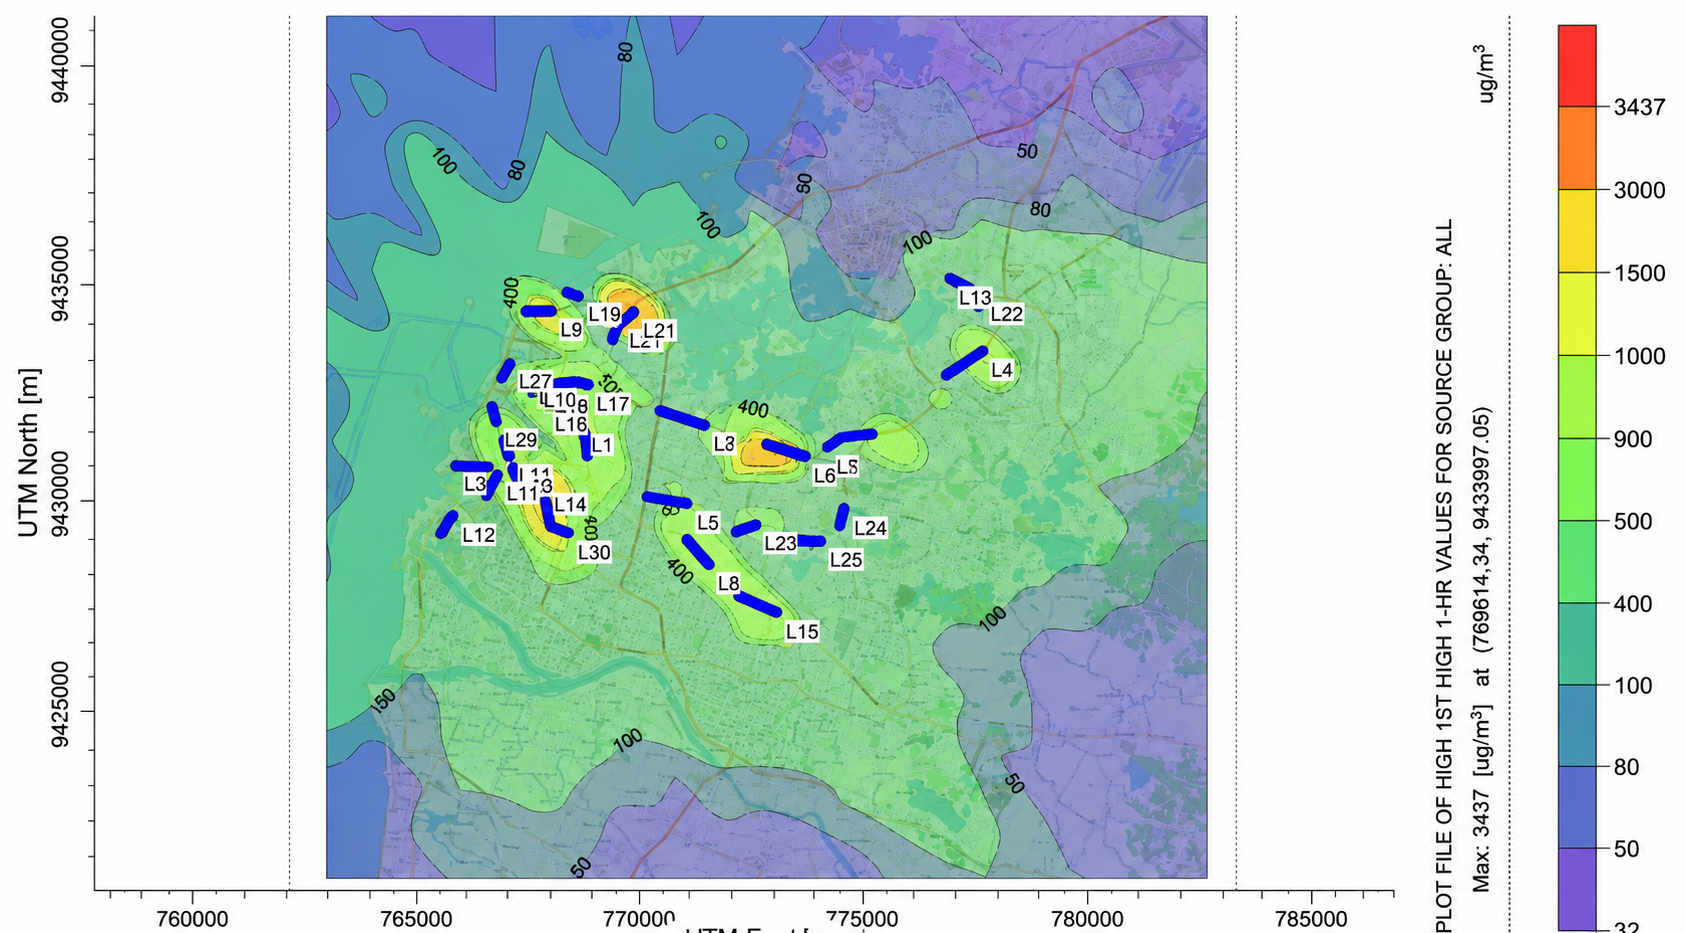
PM10 emission dispersion modeling was performed using AERMOD software, which produced a map of PM10 concentration distribution in the analyzed area. PM10 dispersion was visualized using color gradations on isopleths or contour maps showing variations in concentration levels, where different colors represent different gas concentration levels. Light blue to green colors represent low concentrations or low pollution levels, yellow represents moderate concentrations, orange represents fairly high concentrations, red represents high concentrations, and dark red to purple represents very high concentrations in the area.
This distribution pattern produces an output in the form of an isopleth map, which consists of contour lines connecting points with the same concentration. This isopleth map is applied in the Makassar City area to illustrate the distribution of PM10 over 24 hours at 30 receptor points, with concentration differences displayed in various shapes and colors according to the amount of emissions in the area.
The results of the study show that:
- The PM₁₀ concentration from direct measurements was in the range of 108–258 µg/m³, while the modeling results showed a range of 103–418 µg/m³.
- The PM₁₀ emission load from mobile sources on the road ranged from 0.01–1.54 g/s, with the largest contribution coming from heavy vehicles.
- The distribution pattern of PM₁₀ follows the prevailing wind direction to the northwest, so that areas along this route have the potential for higher pollution.
- Based on Government Regulation No. 22 of 2021, the ambient air quality in Makassar has exceeded the PM₁₀ quality standard (75 µg/m³ for 24 hours), posing a health hazard.
This study emphasizes the importance of controlling motor vehicle emissions and utilizing air quality modeling as an alternative monitoring method. The results can be used as consideration for local governments in formulating urban transportation management and air quality protection policies.
Description
The study entitled “Analysis of PM₁₀ Air Parameters Based on Satellite Images in Makassar City” was conducted to address serious challenges related to urban air pollution. Makassar City, as the center of economic and governmental activities in Eastern Indonesia, has experienced a significant increase in the number of motor vehicles—more than 2 million units in 2024. This condition has a direct impact on air quality, particularly the increased concentration of PM₁₀ particulates, which can cause respiratory health problems and reduce the quality of the living environment.
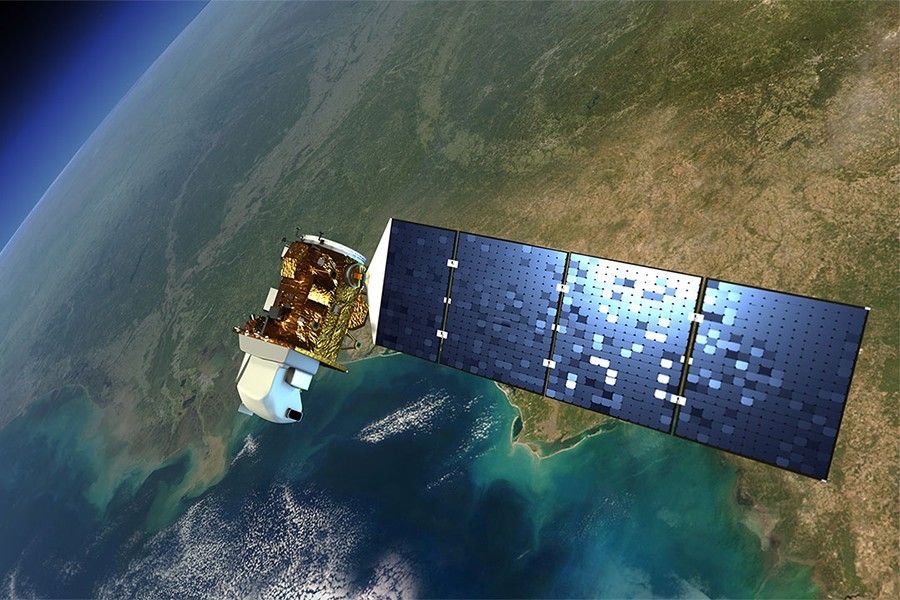
Conventional air quality monitoring in Makassar City is still limited because there are very few Air Quality Monitoring Stations (SPKU) and they are unable to describe the distribution of pollutants evenly. Therefore, this study utilizes remote sensing technology using Landsat 8 OLI/TIRS satellite imagery processed with Google Earth Engine (GEE). PM₁₀ concentration estimates were made by applying two popular algorithms, namely Othman (2010) and Mozafari (2019).
The research method consisted of two main stages:
- Field data collection through PM₁₀ measurements at 30 sampling points throughout the subdistricts of Makassar City using a High Volume Air Sampler (HVAS) in accordance with SNI 7119.15:2016.
- Satellite image processing to extract PM₁₀ concentrations based on the Landsat 8 spectral band, followed by validation using the Root Mean Square Error (RMSE) test against field measurement results.
The results of the study show that:
- The highest PM₁₀ concentrations in the field were found at Pasar Baru Daya (262.9 µg/m³), Makassar Town Square Mall (258.0 µg/m³), and Galangan Kapal (243.6 µg/m³).
- The satellite estimation results showed differences between the algorithms, with the Othman model producing higher predictions (22–58.9 µg/m³)
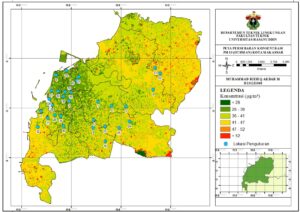
- than the Mozafari model (16–57.6 µg/m³)
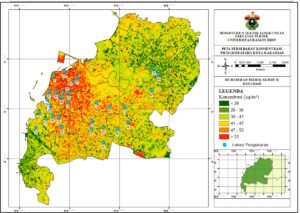 Validation showed a significant correlation between satellite image results and field measurements, with the smallest RMSE of 76.35 (Mozafari, road type 4/1UD) and the largest of 178.82 (Mozafari, road type 2/2UD).
This study contributes to the development of satellite-based air quality monitoring methods, particularly in urban areas with limited conventional monitoring instruments. The results are expected to form the basis for environmental policy-making, more sustainable urban planning, and increased public awareness of the impacts of air pollution.
Description
This study discusses air quality in cement industrial areas with a focus on two main parameters, namely Sulfur Dioxide (SO₂) and Nitrogen Dioxide (NO₂). The cement industry is known as one of the largest contributors to pollutant emissions, which can reduce air quality and endanger the health of surrounding communities. Given the limited number of air monitoring stations, this study uses Landsat 8 satellite imagery processed through Google Earth Engine (GEE) as an alternative to monitor air conditions spatially and temporally.
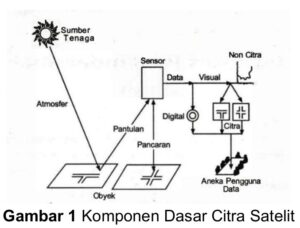
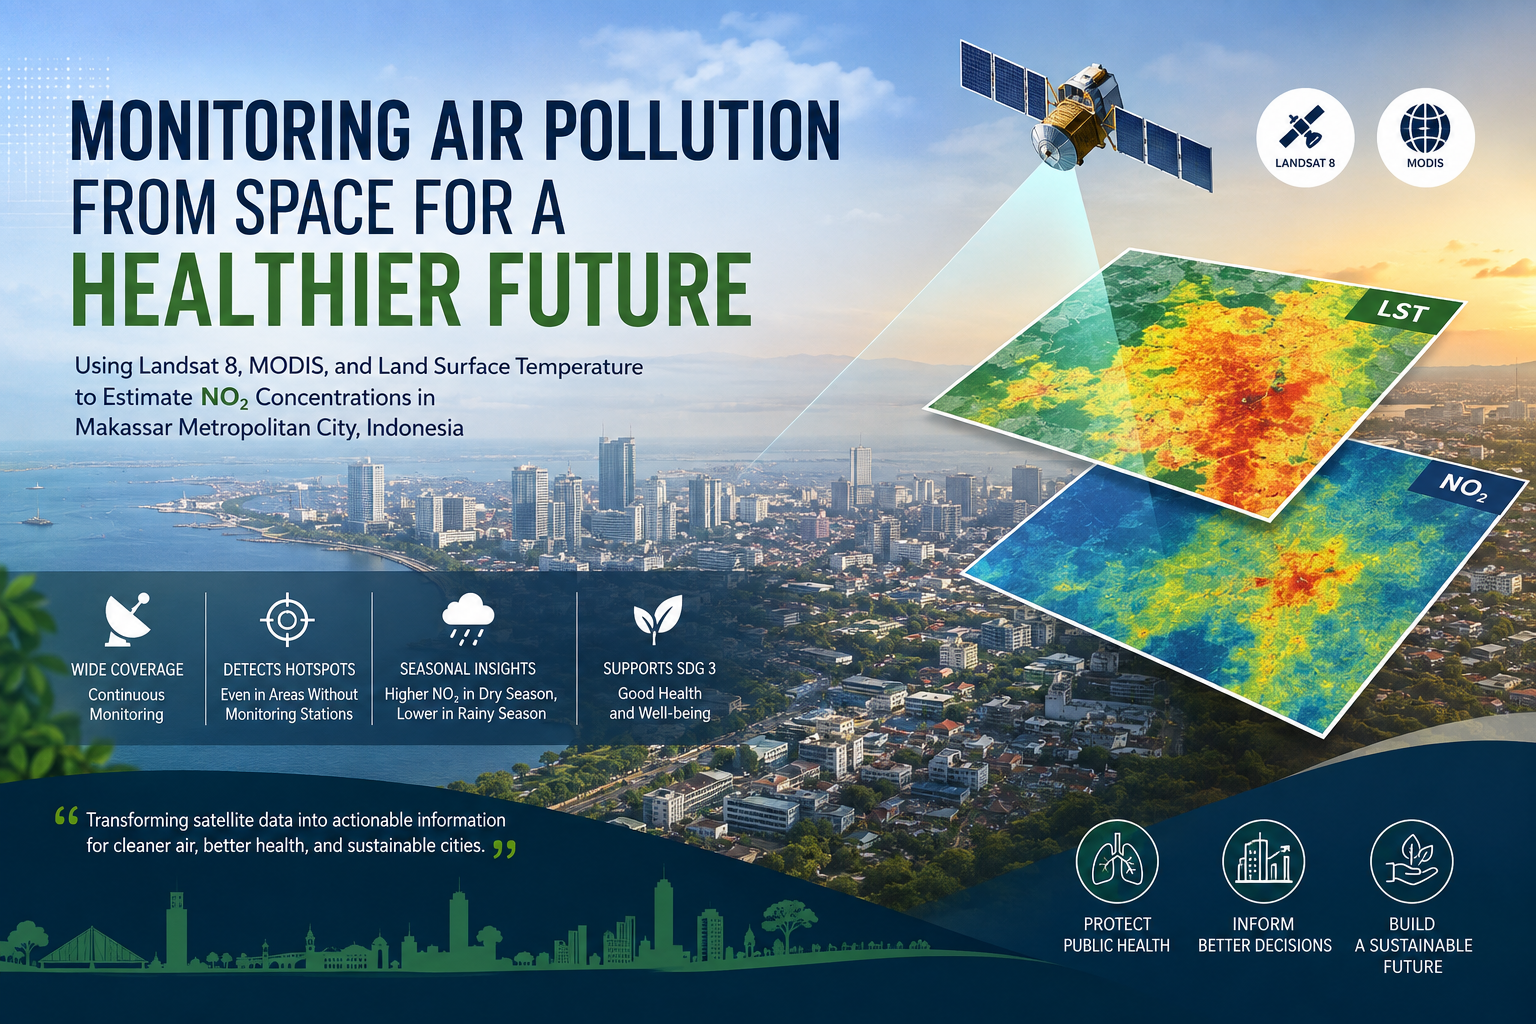
This research method involved extracting land surface temperature (LST) from Landsat 8 SR Collection 2 Level 2 images, then estimating SO₂ and NO₂ concentrations using the Mahardianti et al. (2024) algorithm. This satellite data was then validated with field measurements (October 2023 Test Results Report) using the Root Mean Square Error (RMSE) test to assess the accuracy of the estimation results.
The results of the study show that:
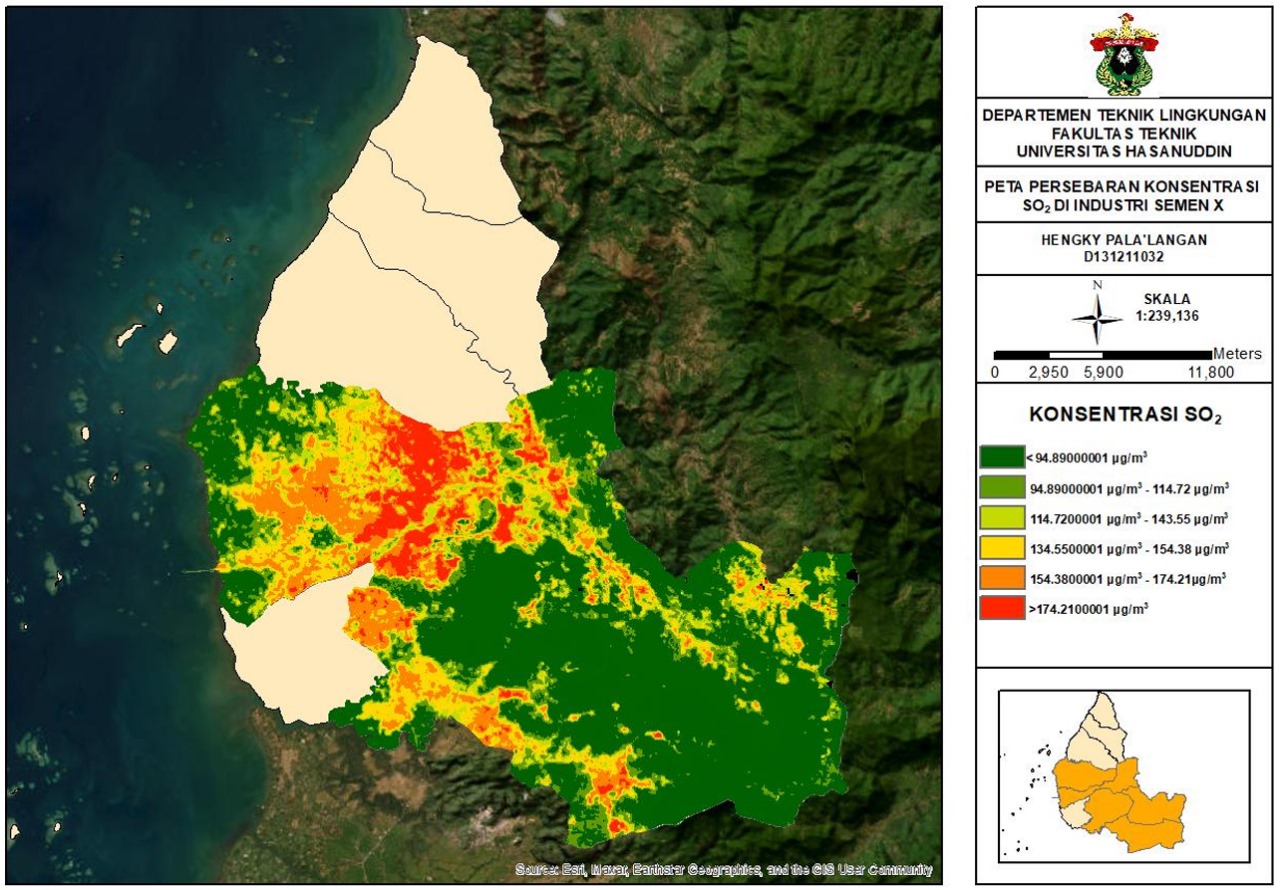
SO₂ concentrations ranged from 73.10 µg/m³ to 204.18 µg/m³, with the highest distribution in active production areas such as kilns and cement factories.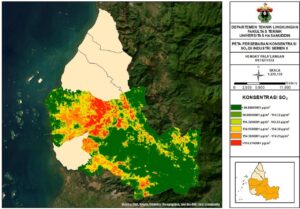
- NO₂ concentrations ranged from 22.23 µg/m³ to 75.62 µg/m³
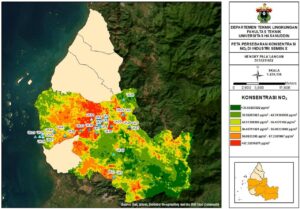 Based on the Air Pollution Standard Index (ISPU) classification, NO₂ was mostly in the “Good” category, while SO₂ was mostly in the “Moderate” to “Unhealthy” category, with the highest ISPU value reaching 169.54 µg/m³ (Unhealthy) for SO₂ and 59.80 µg/m³ (Good) for NO₂.
Overall, this study confirms that the use of satellite imagery through GEE can be an effective method for monitoring air quality in industrial areas, especially in regions with limited field monitoring data availability.
Description
This study is entitled “Air Quality Analysis for Ammonia (NH₃) Parameters in the Tamangapa Landfill Area.” The background of this study is the high amount of organic waste in the Tamangapa landfill in Makassar, which has the potential to produce ammonia (NH₃) gas through the decomposition process. NH₃ gas is toxic, has a pungent odor, and can cause health problems even in low concentrations.
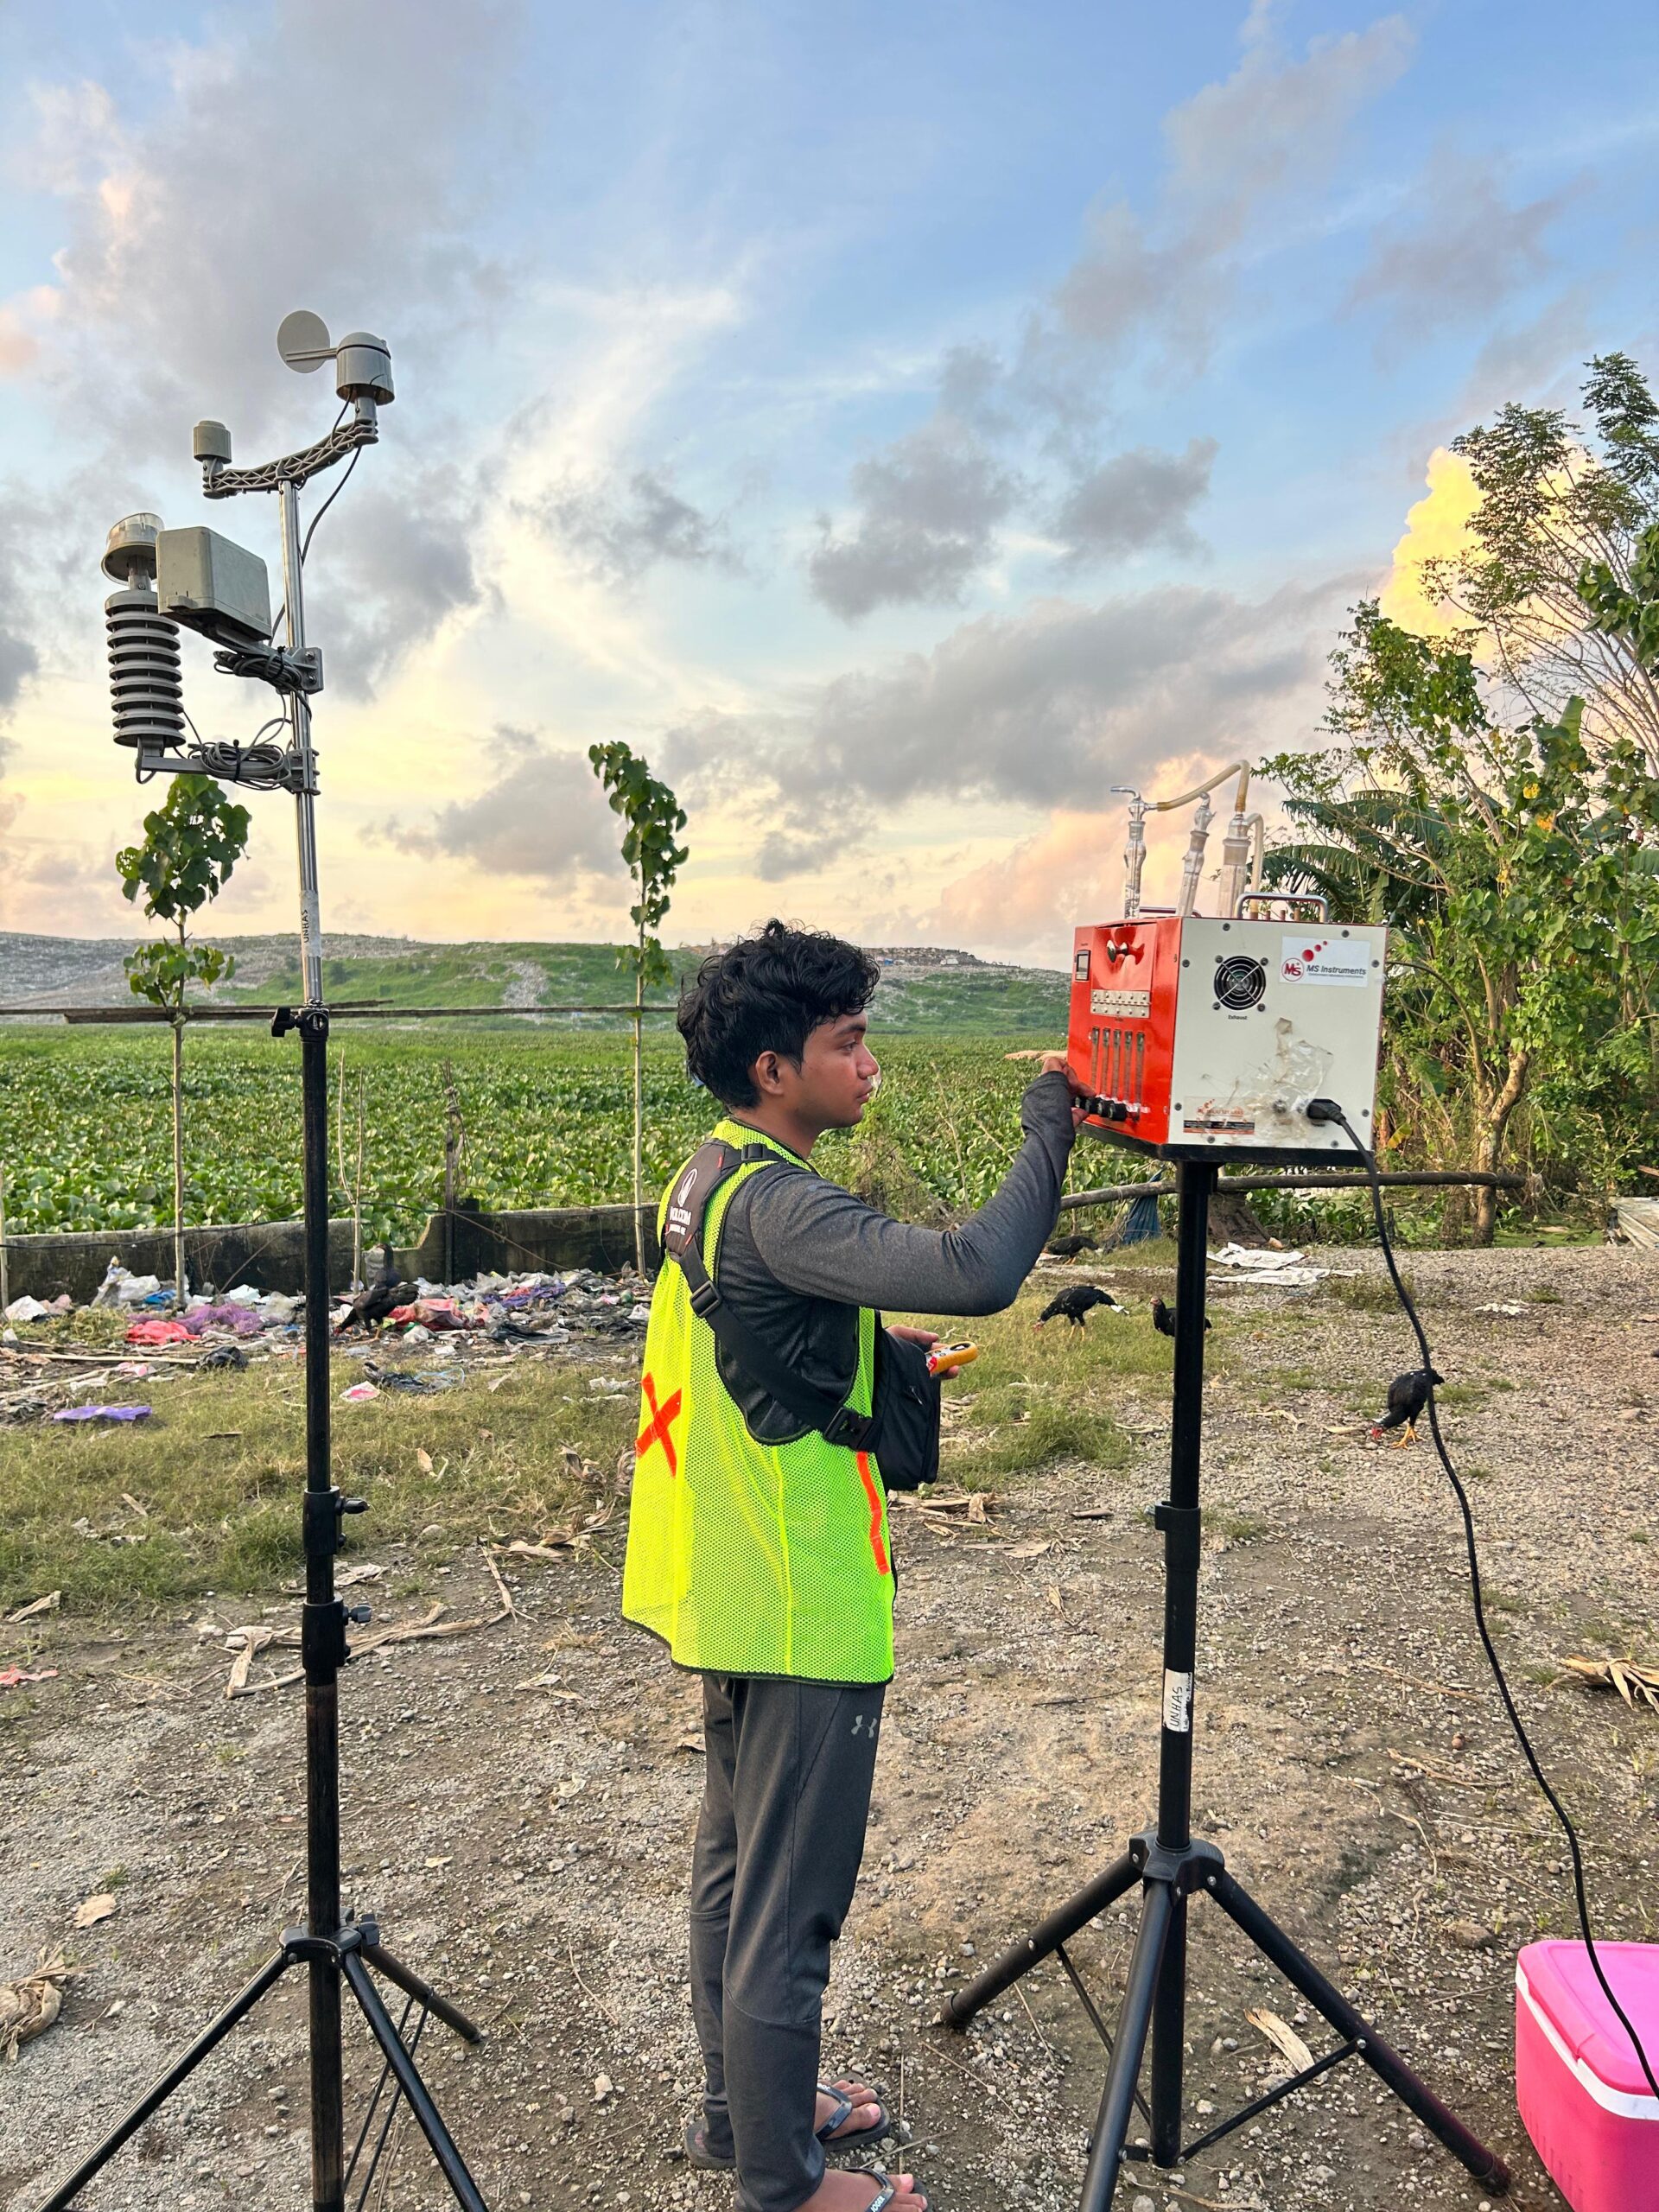
The purpose of this study is to analyze NH₃ concentrations in the Tamangapa landfill area and their relationship with meteorological factors (temperature, humidity, air pressure, and wind speed). The study was conducted at five observation points within a radius of 0-1000 meters from the landfill at intervals in the morning, afternoon, evening, and night. Air samples were collected in accordance with the SNI 19-7119.1-2005 standard and then tested in a laboratory using spectrophotometry. The measurement data were visualized using ArcGIS and statistically analyzed using normality tests and Pearson's correlation through SPSS.
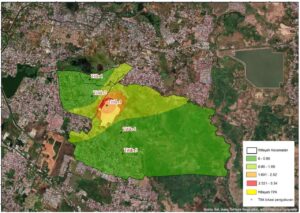
The results showed that the highest NH₃ concentration was found at the core point of the landfill (point 3), namely 5.885 ppm at night, exceeding the quality standard of 2 ppm based on Minister of Environment Decree No. 50 of 1996. Meanwhile, points 1, 2, 4, and 5 (500–1000 m from the landfill) were still below the threshold. Meteorological analysis showed that humidity and air pressure had a significant effect in reducing NH₃ concentrations, while wind speed and direction played a role in its dispersion, and temperature had a weak effect but tended to increase concentrations at high temperatures.
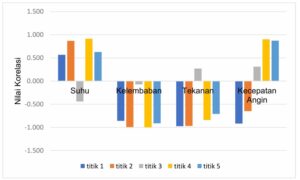
Point 3
Based on the diagram above, it can be seen that there is a correlation between several meteorological data variables, both directly and inversely proportional, although it is not classified as a significant correlation. It can be seen that for meteorological temperature data in the graph above, there is a direct relationship with concentration. This is because when the temperature is high, the concentration of ammonia at the landfill will increase due to evaporation, so that more concentration is dispersed to points 1, 2, 4 and 5, unlike point 3 where the correlation between temperature and concentration is inverse. This is because higher temperatures cause ammonia to evaporate upward, thereby reducing the ammonia concentration at point 3.
In conclusion, air pollution by ammonia gas is concentrated within the core area of the landfill and has not spread significantly beyond a radius of 1000 meters. This study emphasizes the importance of regular air quality monitoring at landfills, as well as the need for mitigation efforts to reduce the impact of pollutants on the health of the surrounding community.