
Every day, thousands of vehicles move through the streets of Makassar, connecting people to work, school, and essential services. While transportation supports economic growth and urban mobility, it also produces an invisible threat that many people rarely think about carbon monoxide (CO). This colorless, odorless, and tasteless gas is released mainly from vehicle exhaust and can seriously affect human health when people are exposed to high concentrations for long periods. Because it cannot be seen or smelled, carbon monoxide is often called the “silent pollutant.”
Understanding where this pollutant accumulates is one of the biggest challenges in urban environmental management. Installing air quality monitoring stations across an entire city requires significant financial investment, making it difficult for many developing cities to obtain comprehensive air quality information. Recognizing this challenge, researchers from Hasanuddin University and their collaborators developed an innovative approach that combines field measurements with computer-based dispersion modeling to estimate how carbon monoxide spreads across different types of roads in Makassar City.
The study assesses CO dispersion from vehicle emissions across five road types in Makassar using field measurements, Tier 2 emission estimation, and AERMOD modeling. Data from 30 locations were compared with model predictions, showing no significant difference (p > 0.05) and confirming AERMOD’s reliability for mapping CO pollution and supporting urban air quality management.
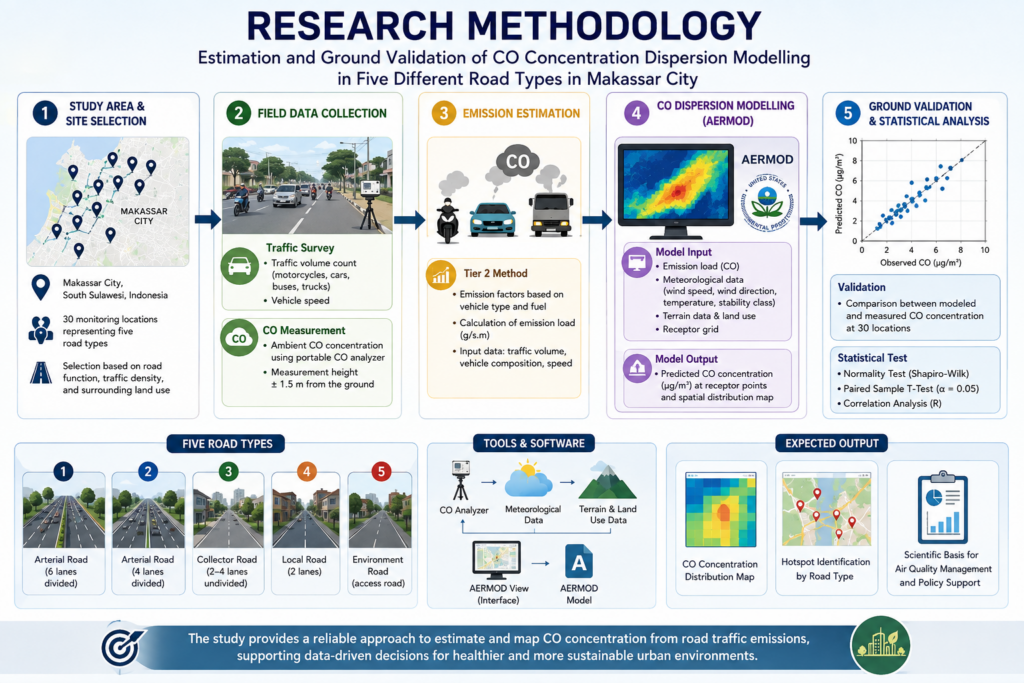
The study analyzed 30 monitoring locations representing five different road categories, ranging from major arterial roads to smaller urban streets. Researchers counted traffic volumes, measured carbon monoxide concentrations directly in the field, and simulated pollutant dispersion using the internationally recognized AERMOD model developed by the United States Environmental Protection Agency (USEPA). The comparison showed that the model closely matched real-world measurements, demonstrating that dispersion modeling can accurately predict carbon monoxide distribution across urban road networks.
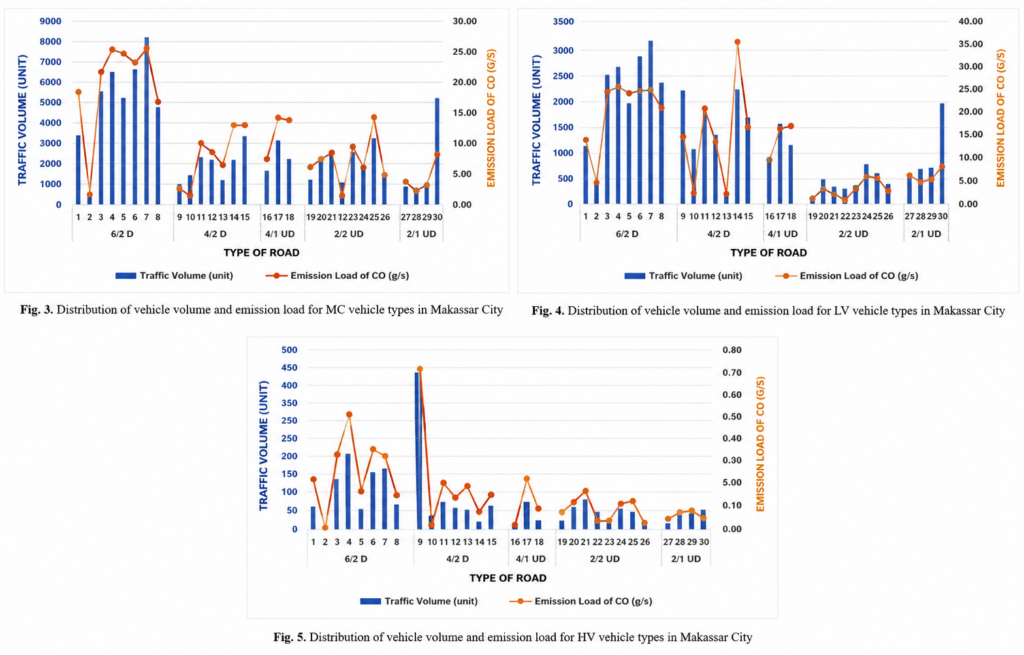
One of the most interesting findings was that road characteristics matter just as much as traffic volume. Major roads with six lanes and two-way traffic produced the highest emission loads because they carried the largest number of vehicles, especially motorcycles and passenger cars. However, some roads with lower traffic volumes still recorded relatively high carbon monoxide concentrations due to their physical characteristics, including road width, length, and surrounding urban structures. This finding highlights that air pollution is influenced not only by the number of vehicles but also by how cities are designed.
Another important contribution of this research is the validation of the dispersion model itself. Statistical analysis showed no significant difference between simulated and field-measured carbon monoxide concentrations, indicating that the model can reliably represent real environmental conditions. This capability is particularly valuable because it enables governments to estimate air pollution levels even in locations where direct monitoring equipment is unavailable. Such predictive tools can support urban planning, traffic management, and environmental policies while reducing monitoring costs.
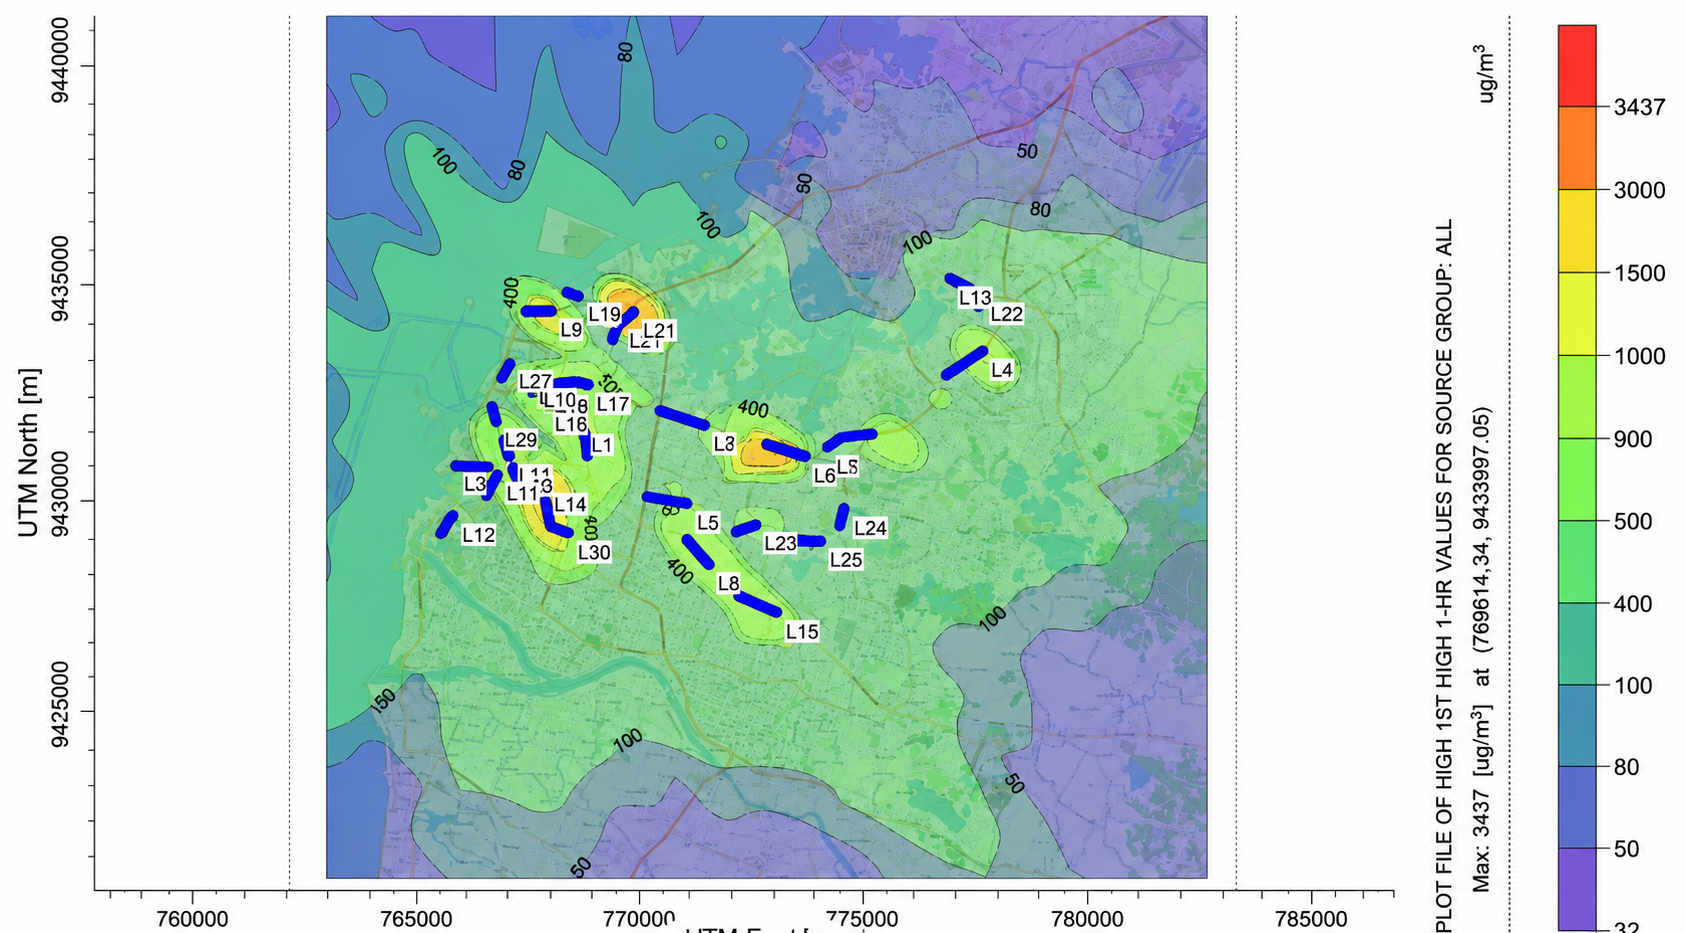
CO emissions varied considerably across road types in Makassar. Type 6/2D roads had the highest emissions due to heavy traffic, particularly from light vehicles and motorcycles. Roads with fewer lanes and no median generally showed lower emissions, although busy routes such as Pasar Terong and Gunung Bawakaraeng remained relatively high due to their role as major access routes and high motorcycle traffic.
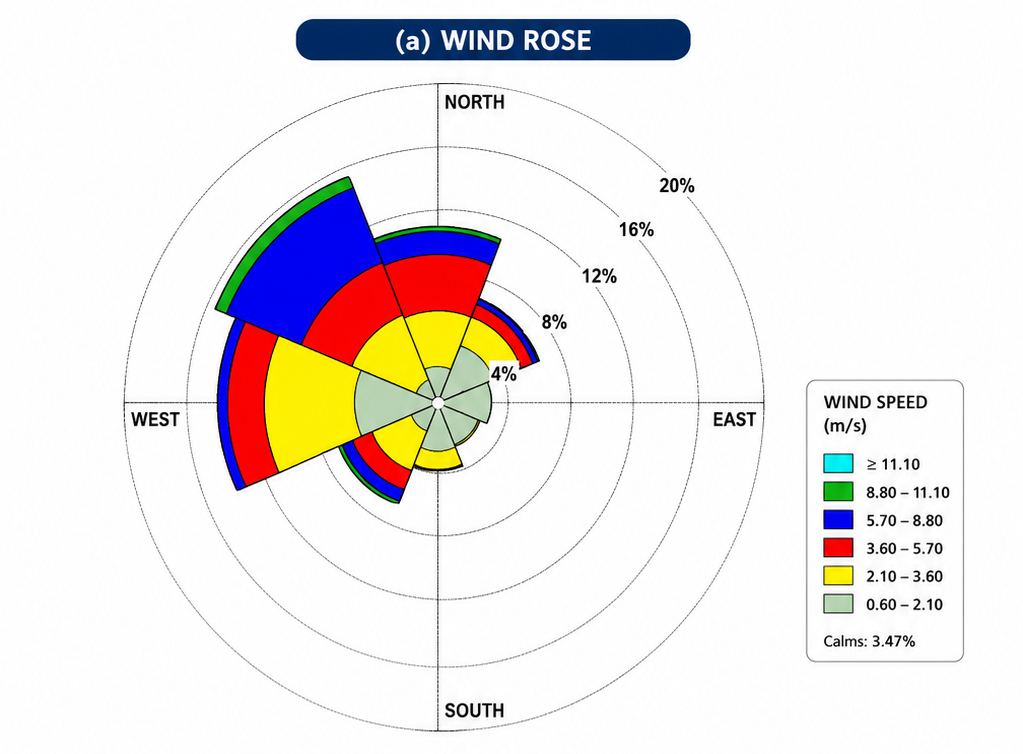
Wind conditions were dominated by northwesterly winds at 5.7–8.8 m/s. CO concentrations generally decreased with increasing distance from the emission source, with concentrations declining within approximately 1 km, influenced by the prevailing wind direction in Makassar.
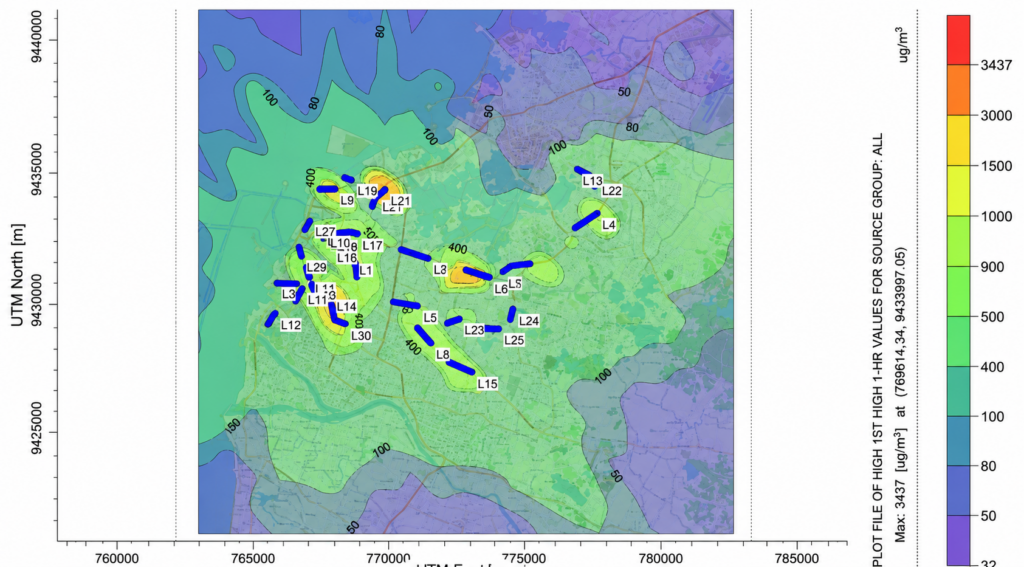
Ground measurements showed substantial variation in CO concentrations across road types. The highest levels occurred on 4/1 UD, 4/2D, and 6/2D, with the highest average concentration on 4/2D (803 µg/m³). Lower concentrations were found on 2/2 UD and 2/1 UD due to lower traffic intensity. However, CO levels were influenced not only by traffic volume but also by road width and geometry, which significantly affect pollutant dispersion.
This research strongly supports Sustainable Development Goal (SDG) 3: Good Health and Well-being. Cleaner air directly contributes to healthier communities by reducing the risk of respiratory illnesses, cardiovascular diseases, and other health problems associated with prolonged exposure to vehicle emissions. Reliable pollution mapping also helps authorities identify high-risk areas, prioritize mitigation efforts, and provide accurate environmental information to the public.
As cities continue to grow, managing air pollution will require more than simply measuring emissions. It will require smarter technologies that can predict pollution before it becomes a serious health threat. Studies like this demonstrate that combining scientific measurements with advanced computer modeling offers a practical solution for building healthier, more sustainable cities. By transforming invisible pollution into visible information, science provides decision-makers with the knowledge needed to protect both people and the urban environment.