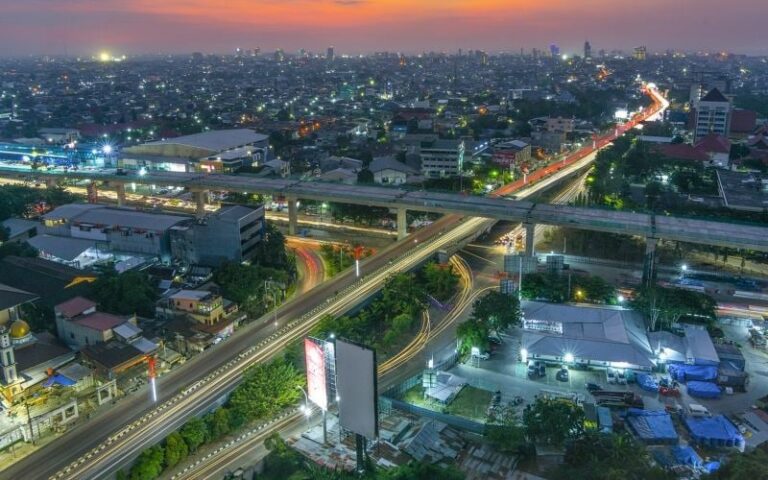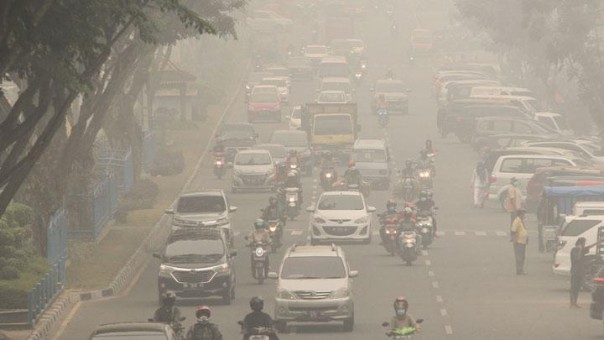

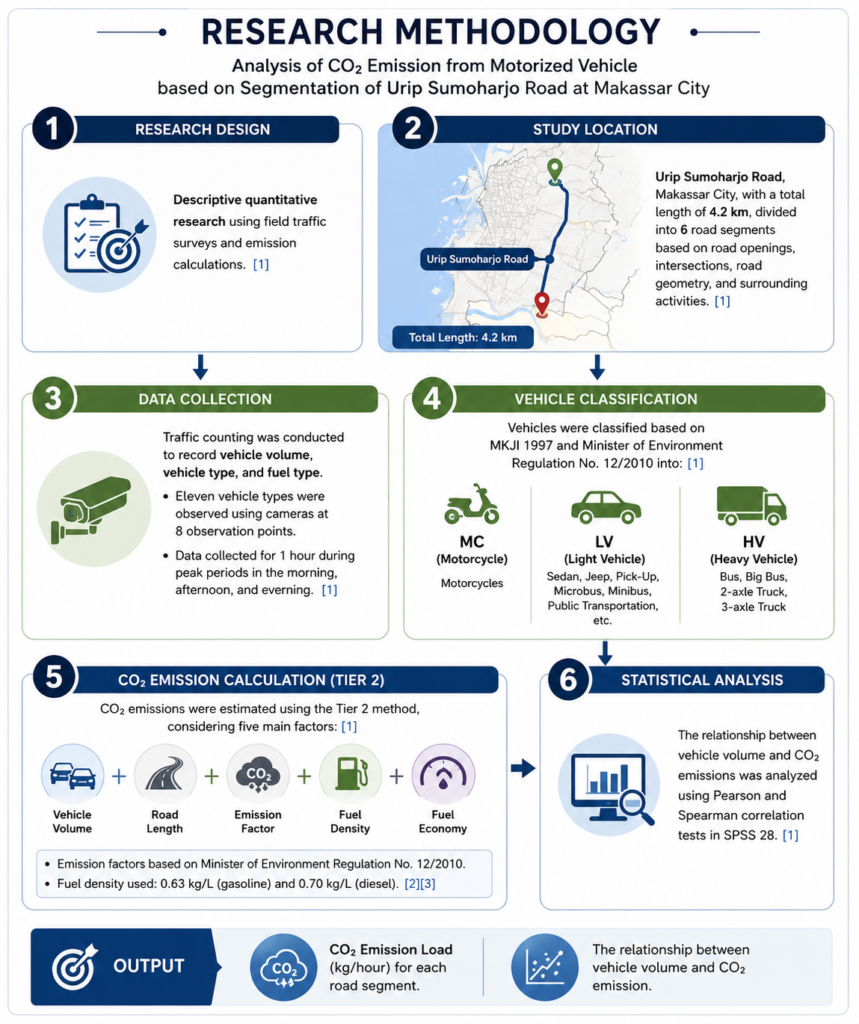
At the end of a working day, Urip Sumoharjo Road in Makassar becomes a familiar scene of urban life. Motorcycles weave through traffic. Cars line up at intersections. Public transportation stops to pick up passengers, while trucks continue their journey through one of the city’s important arterial roads. For most people, the biggest concern is simple: How long will it take to get home? But above the traffic, another question is quietly unfolding: How much carbon dioxide is being released into the air? A scientific study of Urip Sumoharjo Road provides an important answer. The 4.2-kilometre road was divided into six segments to examine how traffic volume, road length, vehicle types, fuel consumption, and fuel characteristics influence CO₂ emissions. The researchers did not simply count vehicles. They looked at the different factors that determine how much carbon dioxide is produced by daily transportation.
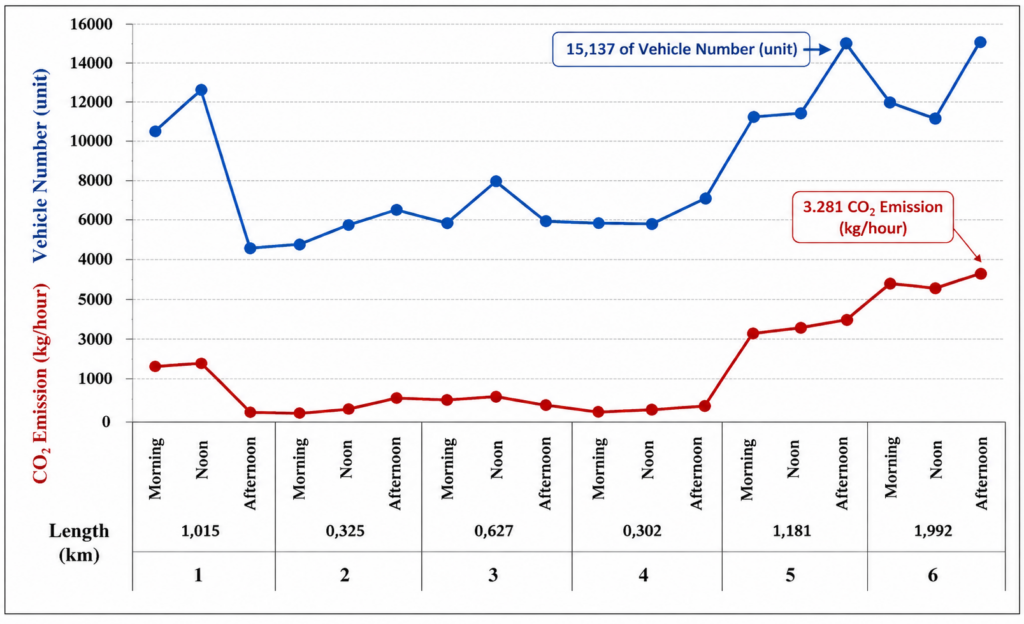
The results show that emissions are not evenly distributed along the road. Segments 6, 5, and 1 recorded the highest CO₂ emissions, ranging from approximately 1,231.1 to 3,281.4 kilograms per hour. These sections were associated with both substantial traffic volumes and longer road distances. In other words, the amount of pollution produced by traffic depends not only on how many vehicles are present, but also on how far they travel and how much fuel they consume. Time also plays a major role. The highest emissions occurred during the afternoon rush hour, between 5:00 and 6:00 p.m. During this period, people are leaving offices, schools, shops, and other activities. The result is a sharp increase in vehicle movement and, consequently, fuel consumption and CO₂ emissions.
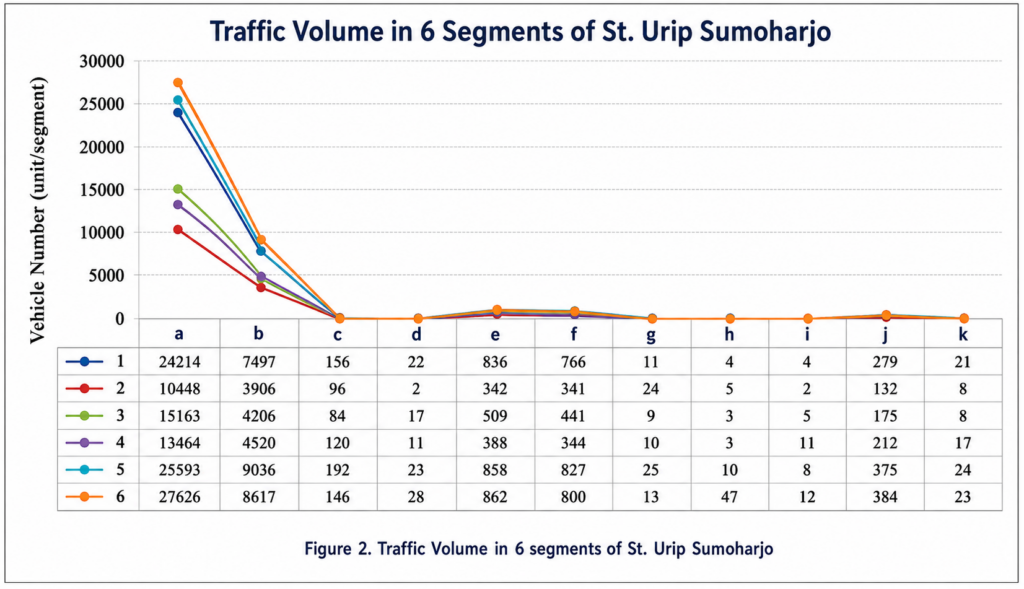
Motorcycles and sedans dominated the traffic flow and became the largest contributors to total emissions. The study found a strong relationship between the number of vehicles and the amount of CO₂ released, with a correlation coefficient of 0.916. This means that, generally, when the number of vehicles increases, emissions also tend to rise. However, the relationship is more complex than simply “more vehicles equals more pollution.” Fuel economy and fuel type also matter. A smaller number of vehicles can still produce significant emissions if they consume fuel inefficiently. This is why understanding the characteristics of each vehicle is essential when cities plan strategies to reduce transportation emissions.
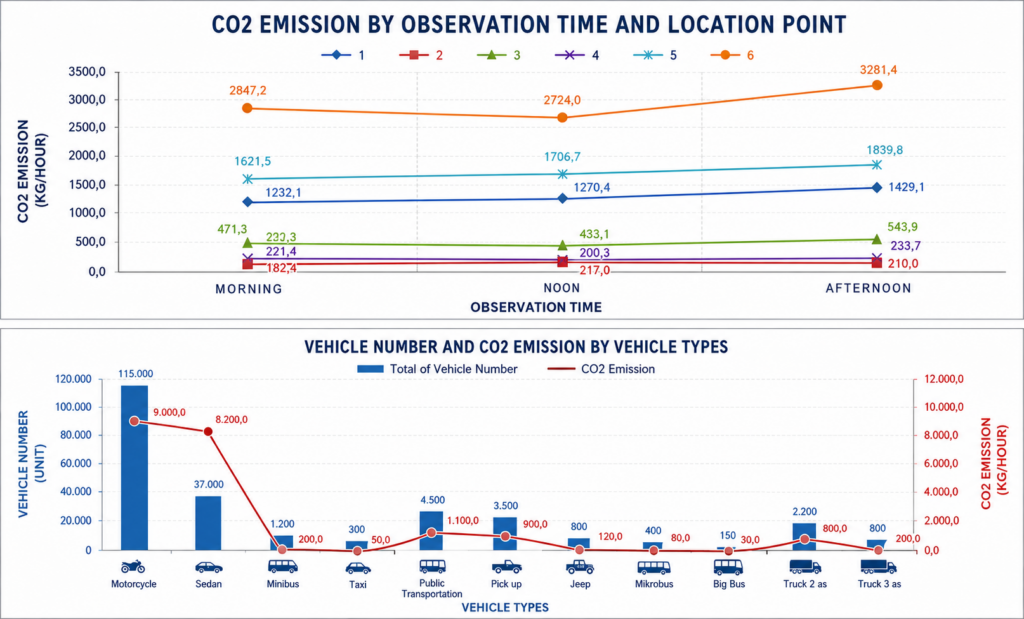
CO₂ emissions show a linear relationship with vehicle volume on St. Urip Sumoharjo. Motorcycles and sedans contributed the most, accounting for 43.9% (9,071.8 kg/hour) and 40.28% (8,322.9 kg/hour), respectively.
The findings are closely connected to Sustainable Development Goal 3 (SDG 3): Good Health and Well-Being. Although CO₂ is primarily recognized as a greenhouse gas, transportation emissions are part of a wider urban environmental challenge. Cleaner mobility, more efficient public transportation, better traffic management, and reduced dependence on fuel-intensive travel can help build healthier cities. This popular science article is based on the publication “Analysis of CO₂ Emission from Motorized Vehicle based on Segmentation of Urip Sumoharjo Road at Makassar City.” The article was published in the International Journal of Engineering and Science Applications, published by the International Journal of Engineering and Science Applications, on 18 May 2022.
For Makassar, the message is clear. Traffic is not only about congestion, travel time, or crowded roads. Every vehicle leaves an environmental footprint. By identifying where and when emissions are highest, scientific research can help cities make better decisions and turn everyday journeys into a step toward a healthier, cleaner, and more sustainable future.