
Every day, millions of people travel through busy city streets without realizing that every journey leaves behind more than tire marks. Hidden within the flow of traffic are invisible pollutants released from vehicle exhausts, quietly affecting air quality, the environment, and the quality of life of urban communities. As cities continue to grow, understanding these emissions is no longer simply an environmental concern it has become a shared responsibility that requires science, technology, and collaboration.
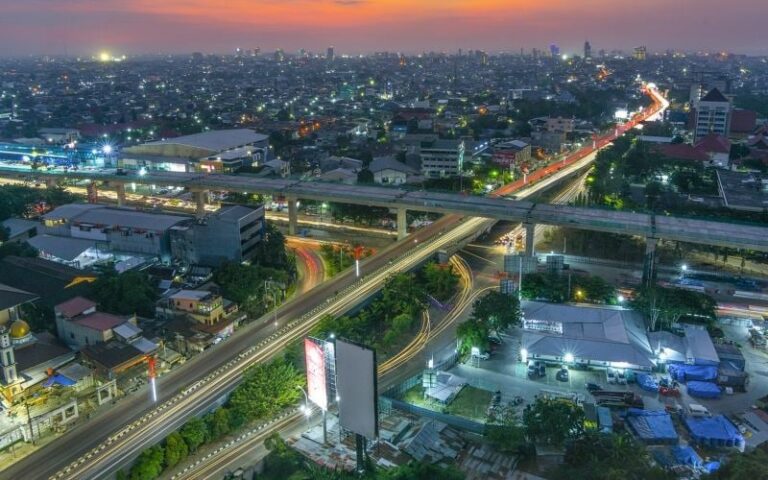
Makassar City is no exception. As one of Indonesia’s fastest-growing metropolitan areas, the city experiences increasing traffic congestion driven by rapid urban development, commercial activities, and population growth. Pengayoman Street, one of Makassar’s busiest commercial corridors, illustrates this challenge clearly. Every day, hundreds of vehicles move through this road, creating congestion that not only delays commuters but also increases the amount of pollutants released into the atmosphere. While these emissions are invisible, their impacts are measurable and increasingly significant.
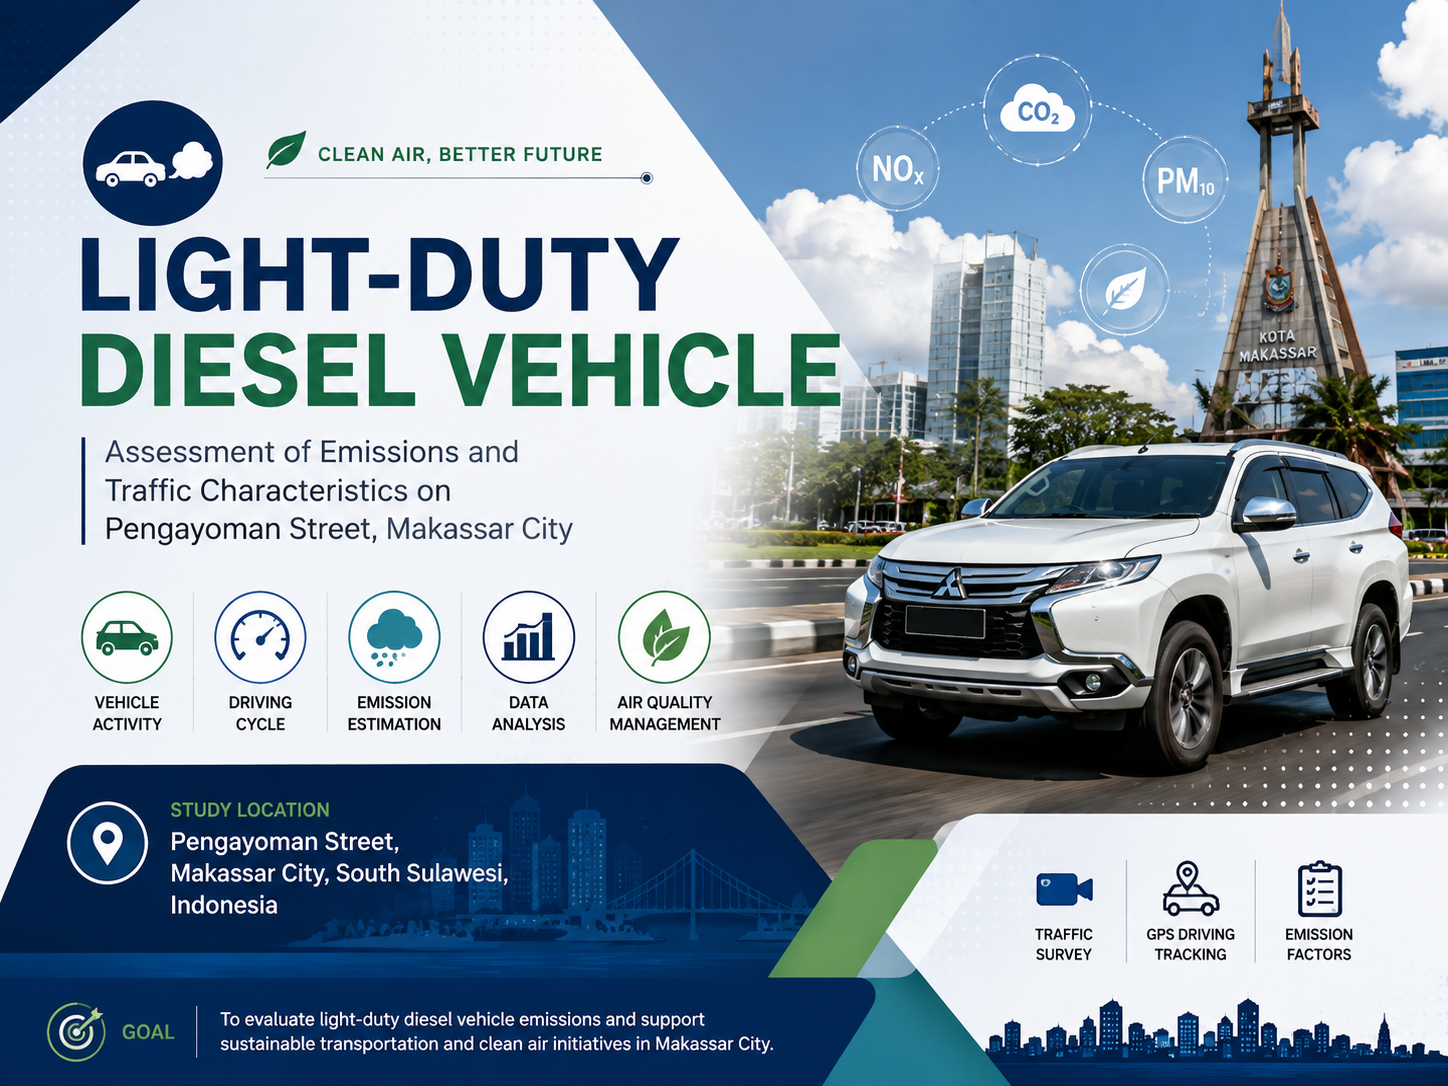
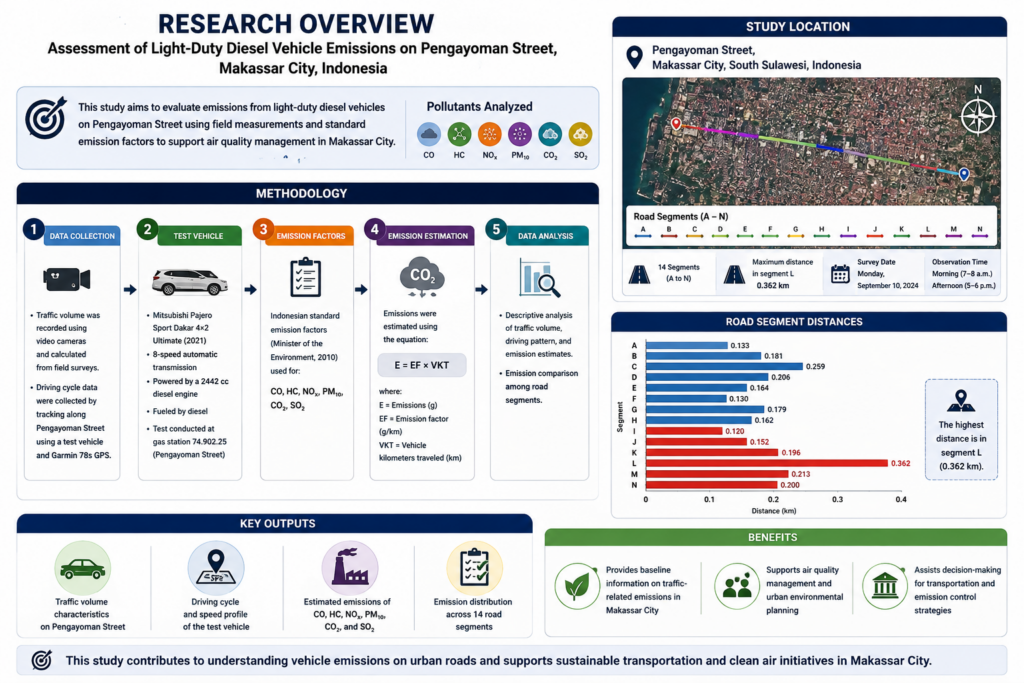
This study used a quantitative and descriptive approach to assess light-duty diesel vehicle emissions on Pengayoman Street, Makassar. Primary data included vehicle volume, driving cycle, and test-vehicle data, while secondary data consisted of Indonesian vehicle emission factors. Vehicle volume was recorded using video cameras, and driving-cycle data were collected using a test vehicle equipped with a Garmin 78s GPS. Pengayoman Street was divided into 14 segments (A–N) covering two traffic directions: A–H and N–I. Segment L had the longest distance (0.362 km). Data were collected on 10 September 2024, during morning (07:00–08:00) and afternoon (17:00–18:00) peak hours.
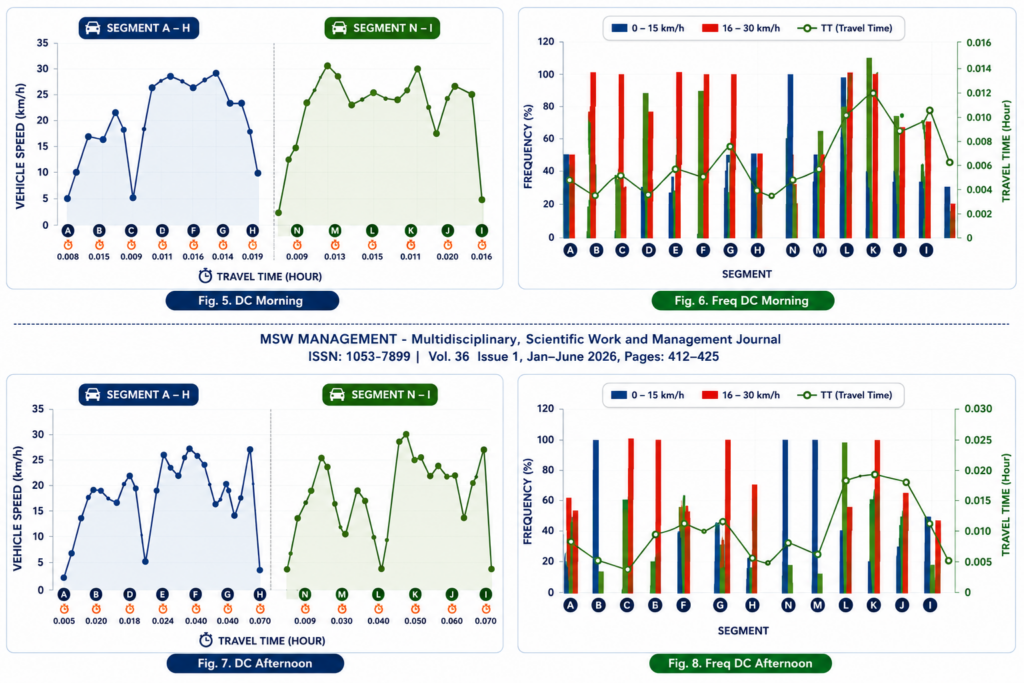
The decrease in speed and increase in travel time indicate that congestion levels are higher during the afternoon rush hour compared to the morning rush hour.
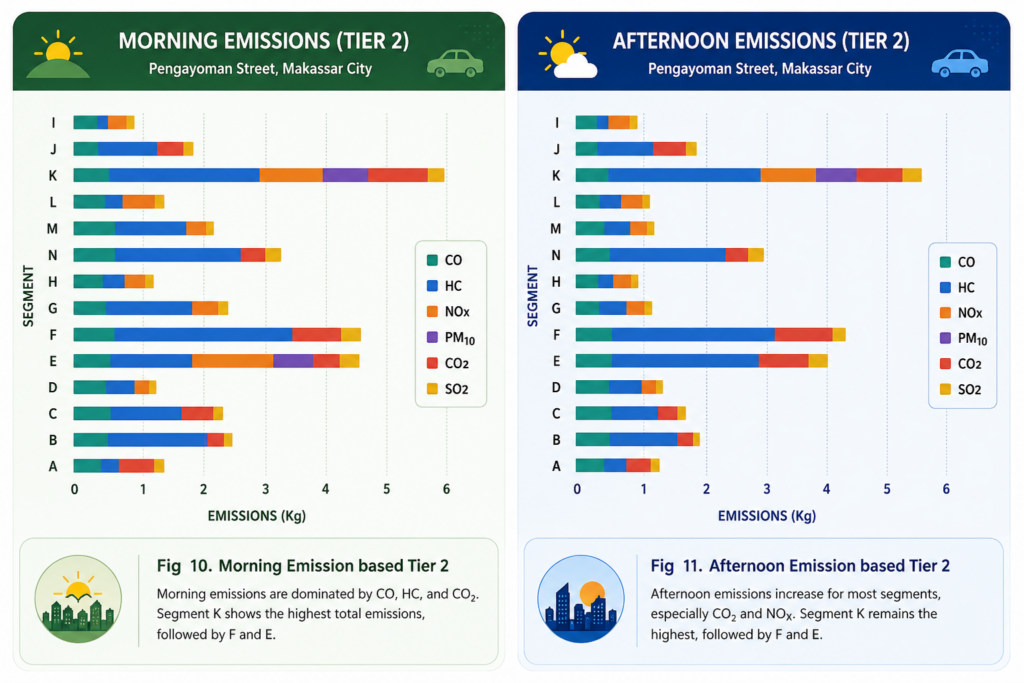
During the morning and afternoon peak hours, Segment K had the highest emissions because its VKT values were also high during those times. Segment N had the least emissions during the morning rush hour, and segment H had the least emissions during the afternoon rush hour. This was because their VKT values were so low.
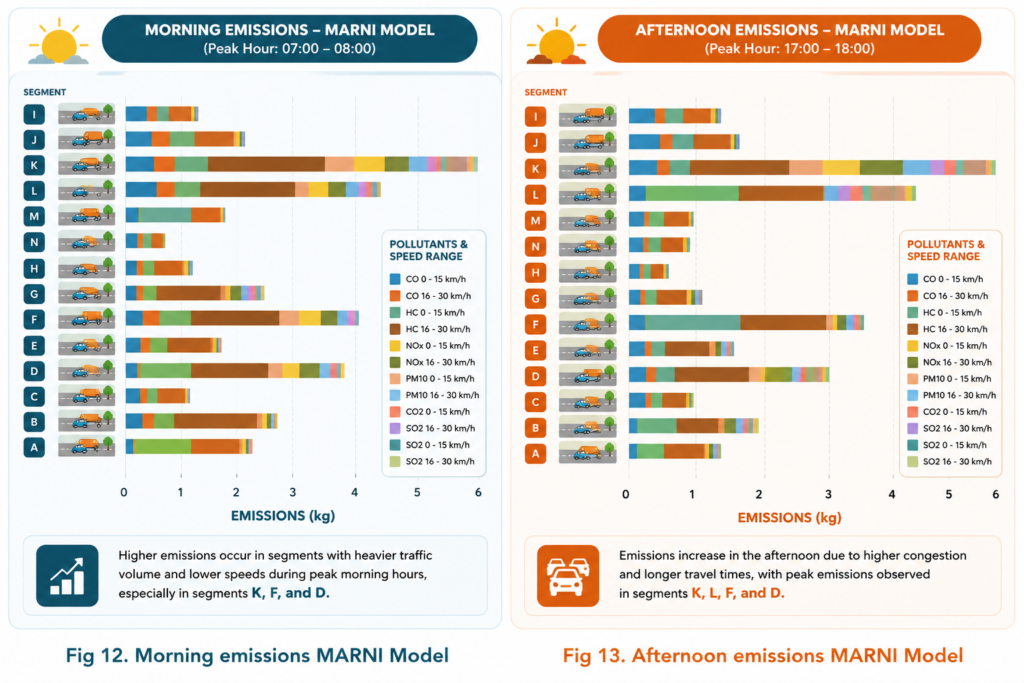
Metropolitan Traffic Emissions Inventory Model demonstrates that emissions from diesel light-duty cars depend on the driving cycle. The results of the The Metropolitan Traffic Emissions Inventory Model emissions calculations show the same results as the IPCC Tier 2 calculations. During the morning rush hour, Segment K has the highest emissions at velocities ranging from 16 to 30 km/h.
Recognizing this issue, researchers conducted a comprehensive study to understand how diesel-powered light-duty vehicles contribute to urban air pollution along Pengayoman Street. Instead of relying on a single analytical approach, the study compared two internationally recognized emission estimation methods: the IPCC Tier 2 Method and the Metropolitan Traffic Emissions Inventory (MARNI) Model. Vehicle volume, driving speed, travel distance, and traffic conditions were analyzed across fourteen road segments to produce a detailed picture of how emissions vary within a single urban corridor.
The findings reveal that traffic characteristics strongly influence emission levels. Segment K consistently recorded the highest emissions because it combined longer travel distances with heavier traffic volumes and prolonged travel times. Carbon dioxide (CO₂) and nitrogen oxides (NOₓ) emerged as the dominant pollutants produced by diesel vehicles, while emissions increased significantly during afternoon rush hours as congestion forced vehicles to move at lower speeds and spend more time on the road. These results demonstrate that traffic congestion is not simply a transportation issue it is also an environmental challenge that directly influences urban air quality.
Perhaps the most valuable contribution of this research is not only its findings but also its methodology. By statistically comparing both emission estimation methods using the Root Mean Square Error (RMSE), the researchers confirmed that the two models produced highly consistent results. This validation strengthens confidence in the use of emission models for environmental planning, particularly in cities where direct emission measurements are difficult or expensive to conduct. Reliable scientific methods provide policymakers with stronger evidence for designing effective transportation and environmental policies.
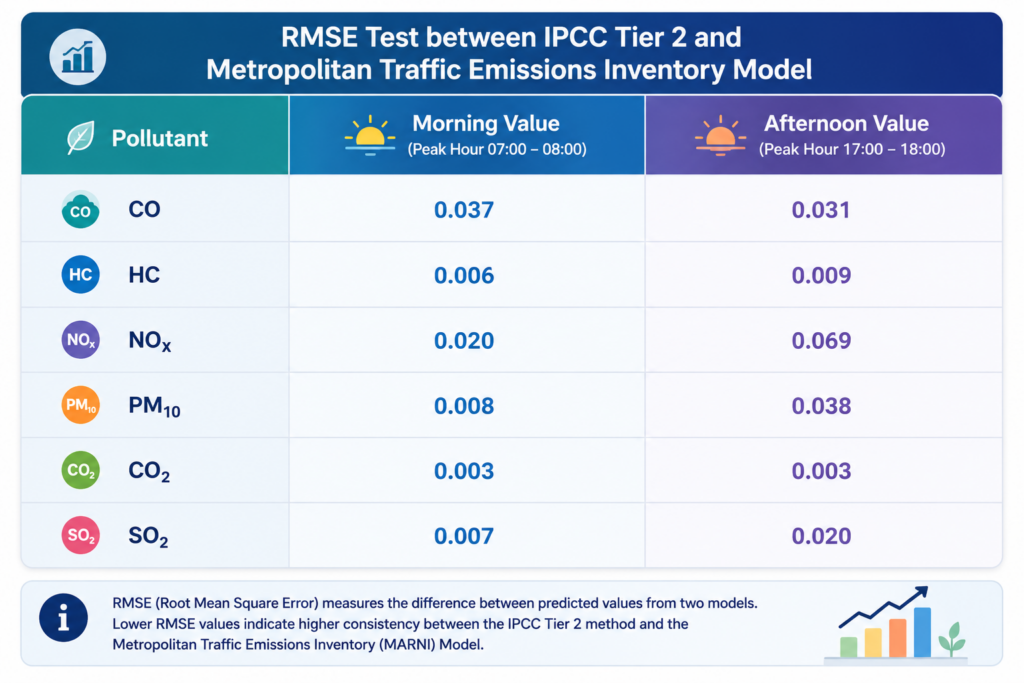
This achievement reflects the spirit of Sustainable Development Goal (SDG) 17: Partnerships for the Goals. Environmental challenges such as urban air pollution cannot be solved by governments alone. They require collaboration among universities, researchers, transportation authorities, environmental agencies, and local communities. In this study, the integration of internationally recognized emission models, field traffic observations, statistical validation, and local environmental data demonstrates how interdisciplinary partnerships can transform scientific research into practical solutions. Such collaboration creates a bridge between scientific knowledge and public policy, ensuring that environmental decisions are supported by credible evidence.
More importantly, this research reminds us that every traffic jam contains valuable information. When scientists, policymakers, and communities work together, ordinary roads become living laboratories capable of guiding smarter urban planning, cleaner transportation systems, and healthier cities. Sustainable development is not achieved through technology alone it grows through partnerships that transform data into action and research into meaningful change.