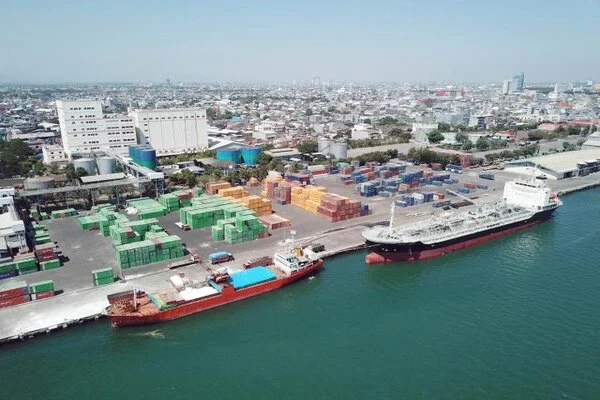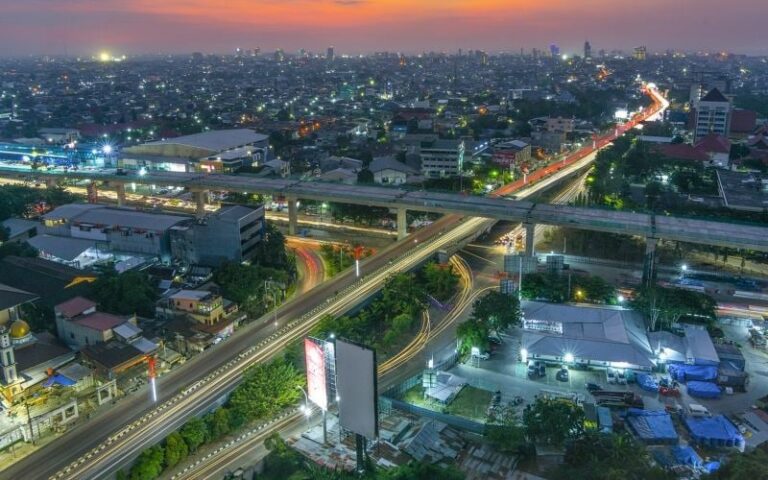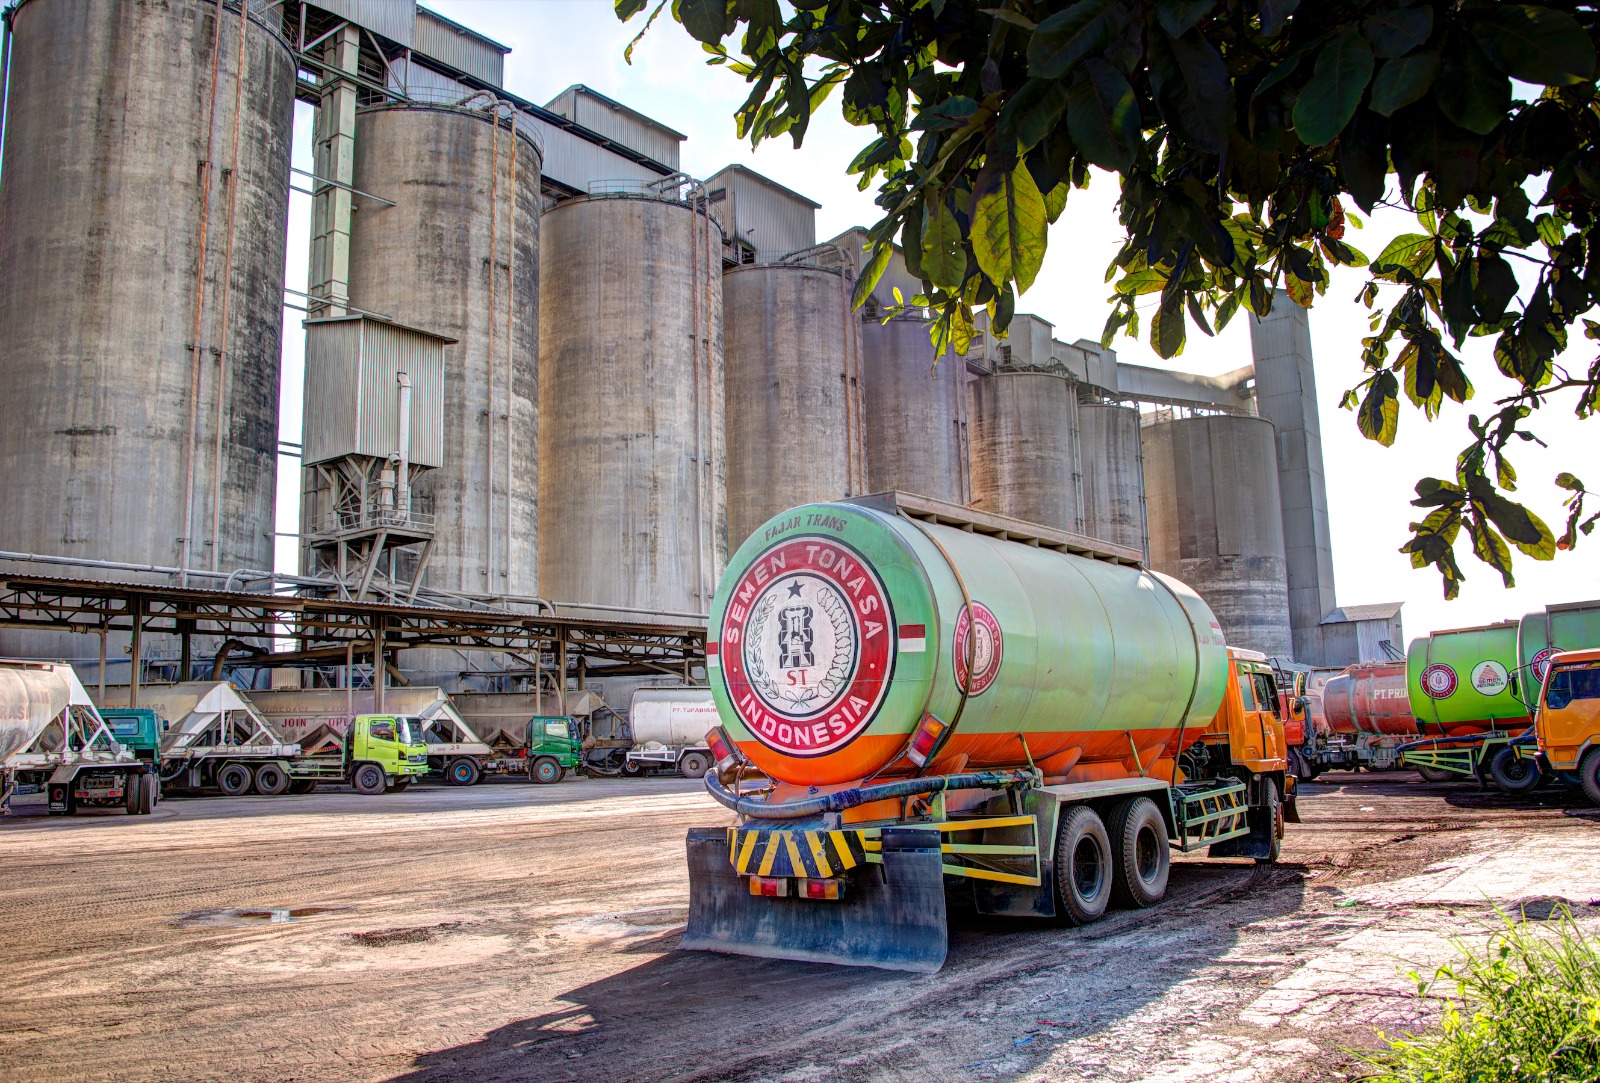

This research activity began with an in-depth literature study on air pollution, particularly related to fine particles (PM₁₀) and carbon monoxide (CO) gases produced by cement industry activities. This stage was carried out to understand the theoretical basis of the impact of industrial emissions on air quality, as well as the working principles of remote sensing and the use of satellite imagery for environmental analysis. The researchers also studied various algorithms commonly used to extract air quality information from satellite imagery, such as the Othman, Mozafari, and Somvanshi algorithms.
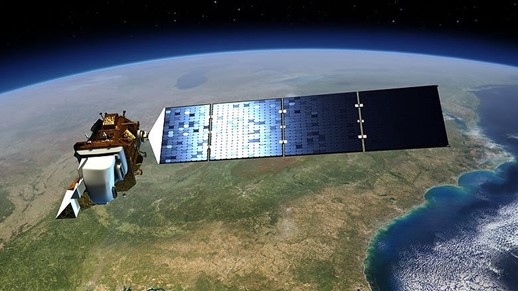
After the theory and methodology were understood, the activity continued with the collection of satellite image data. The data used were Sentinel-2 and Landsat 8 OLI/TIRS images downloaded from official portals such as Sentinel EO Hub and USGS Earth Explorer. The data collected were acquired in October 2023 and October 2024, selected to provide an annual comparison during the dry season, when pollutant concentrations tend to be higher. Additionally, researchers obtained direct air quality measurement data from official reports of the cement industry (Cement Industry X), used as validation data for satellite image estimation results.
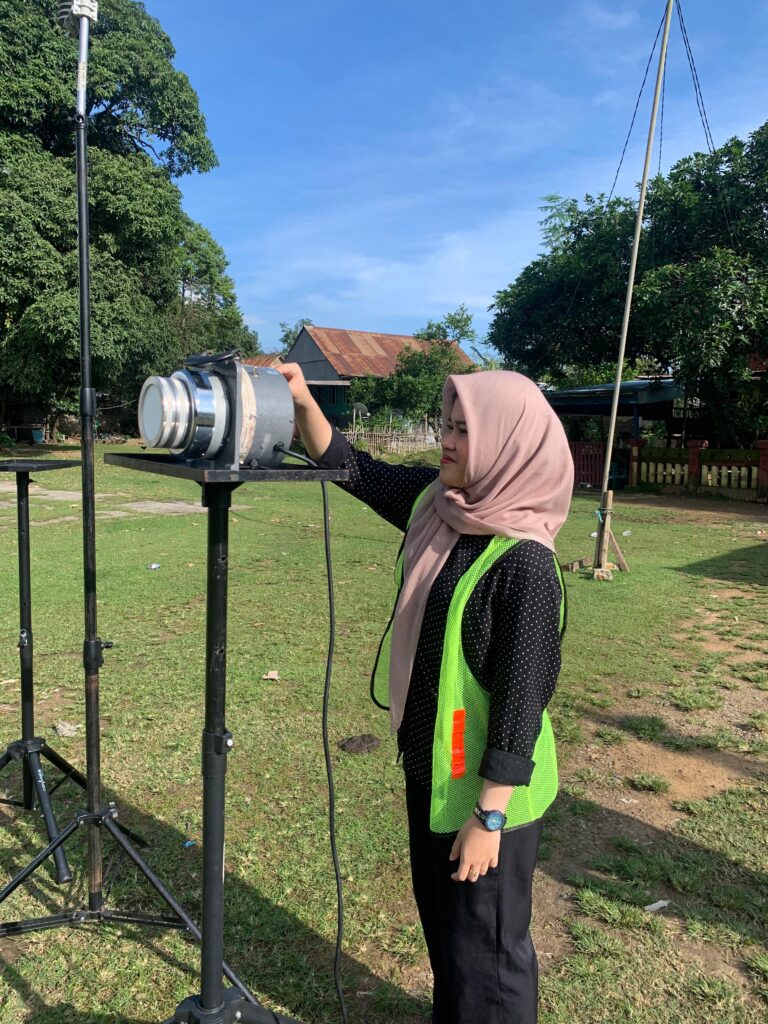
The next step is image pre-processing, which includes geometric, atmospheric, and radiometric corrections. This is important to ensure that the data used is free from lighting, atmospheric, and orbital position disturbances. After the corrections are made, the image data is cropped according to the study area (AOI – Area of Interest) covering the cement industry area and its surroundings. Next, spectral reflectance values are extracted from specific bands required in the air quality estimation algorithm.
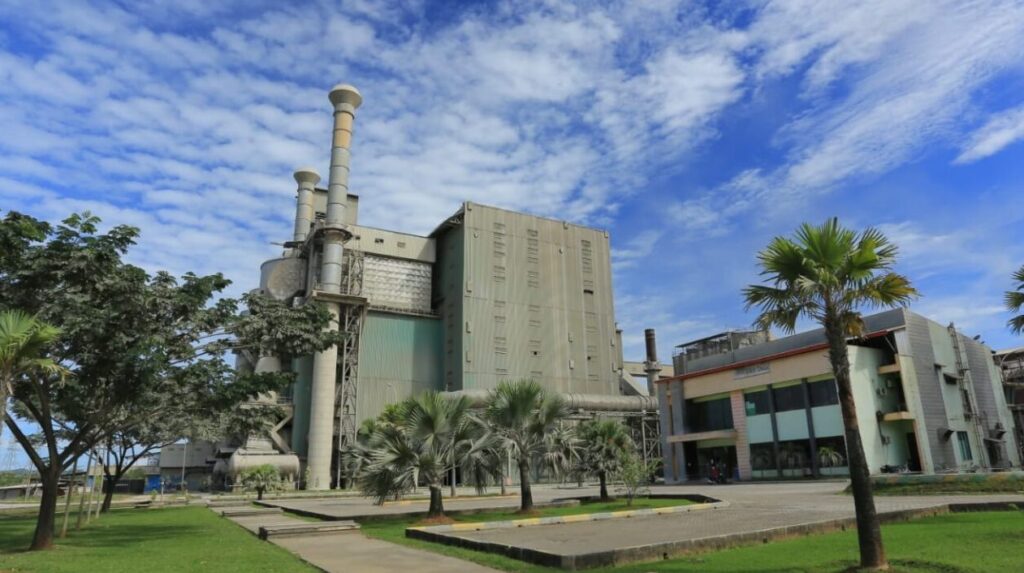
Then, the satellite images are processed using the Othman and Mozafari algorithms to calculate PM₁₀ concentrations, and the Somvanshi algorithm to calculate CO concentrations. This process was carried out using QGIS 3.40.4 and ArcMap 10.8 software, and raster processing was performed using tools such as a raster calculator. The estimated values were then converted into raster format and visualized in the form of spatial distribution maps to show the distribution patterns of pollutants for each year.
The next step in the analysis is to convert the pollutant concentration values into the Air Pollution Standard Index (ISPU) using the guidelines of PERMENLHK No. 14 of 2020. The ISPU provides an interpretation that is easier for the public to understand because it categorizes air quality into categories such as Good, Moderate, Unhealthy, and Hazardous. This study also conducted a Root Mean Square Error (RMSE) analysis as a form of validation for satellite estimation results, which were compared with direct measurement data from industries. RMSE is used to measure the difference between estimated data and actual field data, thereby determining the accuracy level of the model used.
The analysis results show that PM₁₀ and CO concentrations around industrial areas fluctuate from year to year. The average PM₁₀ concentration in 2023 was 47.69 µg/m³ and increased to 53.61 µg/m³ in 2024. For CO, the average concentration ranged from 83.22 to 83.61 µg/m³ in both years. The ISPU calculation results showed that the air quality for PM₁₀ was in the Moderate category, while for CO it remained in the Good category. The RMSE value obtained was 13.98, indicating that the model was sufficiently accurate for estimating air quality using satellite imagery.
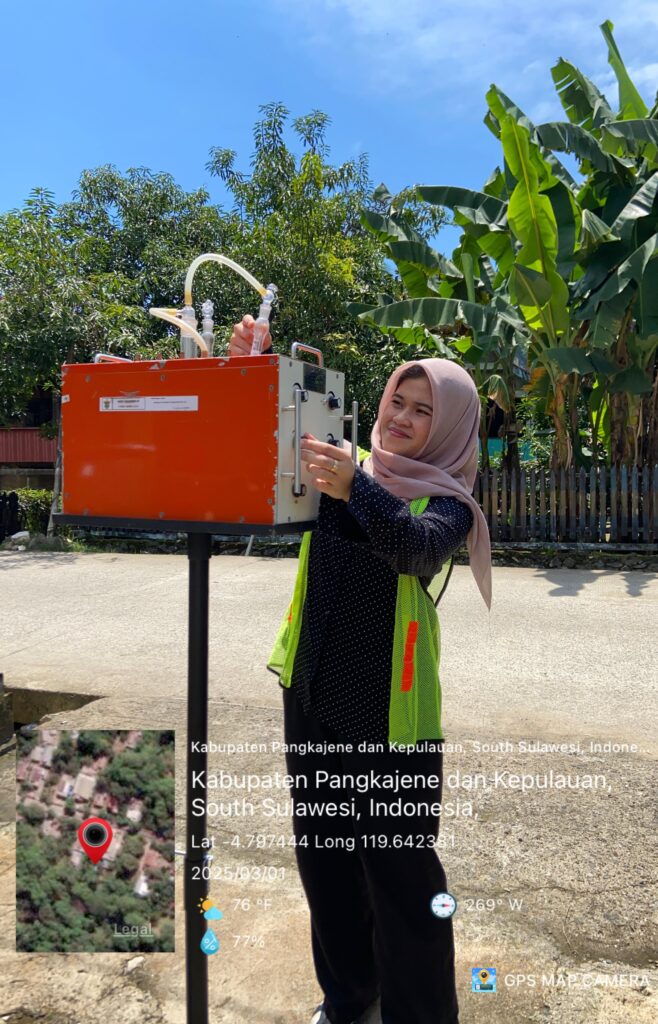
Overall, this research involved various technical and analytical stages, from satellite image data acquisition, image processing, algorithm application, spatial and statistical analysis, to validation with field data. This study demonstrates that the use of satellite imagery can be an effective and efficient method for spatially and temporally monitoring air quality in industrial areas, and can serve as an alternative support in sustainable environmental monitoring systems.