

MAKASSAR, Indonesia 10 September 2026/SRI-RG/- Between 2000 and 2020, Makassar City’s average land surface temperature climbed by nearly 6°C, while its built-up land expanded by an estimated 1,500 to 2,000 hectares in just five years at the fastest point of growth. Satellites watching from orbit captured every step of that transformation, pixel by pixel, year by year.
But what if you could rewind two decades of a city’s growth and watch, almost frame by frame, exactly when and where its green cover disappeared?
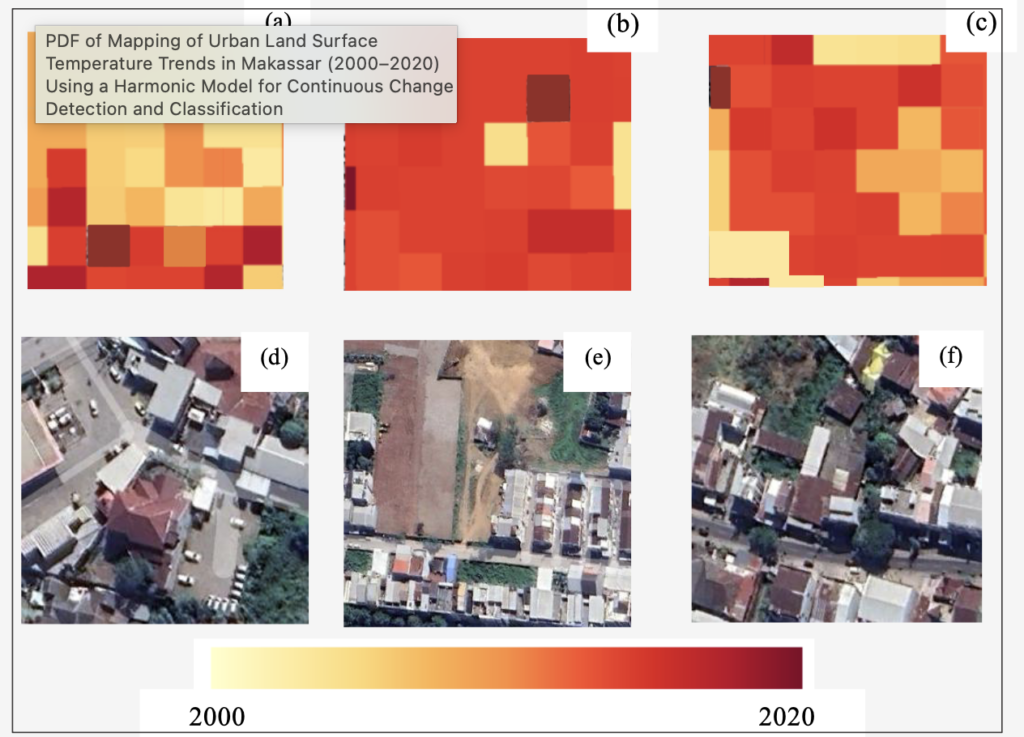
A newly published study did just that. The research, titled “Mapping of Urban Land Surface Temperature Trends in Makassar (2000-2020) Using a Harmonic Model for Continuous Change Detection and Classification,” was published in the International Journal of Geoinformatics in July 2026. Using two decades of Landsat satellite imagery and a statistical method called Continuous Change Detection and Classification (CCDC), researchers tracked vegetation and surface temperature across Makassar year by year, rather than comparing only a handful of snapshots.
Unlike simpler before-and-after comparisons, the harmonic model could pinpoint the exact moment vegetation started disappearing at a given location, even distinguishing a temporary dip in greenery, such as after a seasonal clearing, from permanent conversion to buildings and pavement. The results identified 2010 to 2015 as the period of most intense land conversion, with built-up land growing by roughly 1,826 hectares in that window alone, closely tied to Makassar’s 2010-2030 spatial planning priorities around ports, industry, and new settlements. Most vegetation loss detected by the model clustered around 2013-2014, a timing that lines up almost exactly with the city’s period of fastest development.
As green cover thinned, temperatures rose. City-wide median land surface temperature climbed from 22.21°C in 2000 to a peak of 29.64°C in 2015, before easing slightly to 28.16°C by 2020, an average warming rate of about 0.285°C every year over the two decades. The relationship between vegetation and heat was consistent and statistically significant throughout the study, with areas that lost the most vegetation reliably running hottest, and the correlation between greenness and surface temperature was strongest in 2015, right at the peak of the city’s development boom. To make sure the satellite-based readings could be trusted, the team also checked them against ground measurements, finding a strong match between the two datasets.
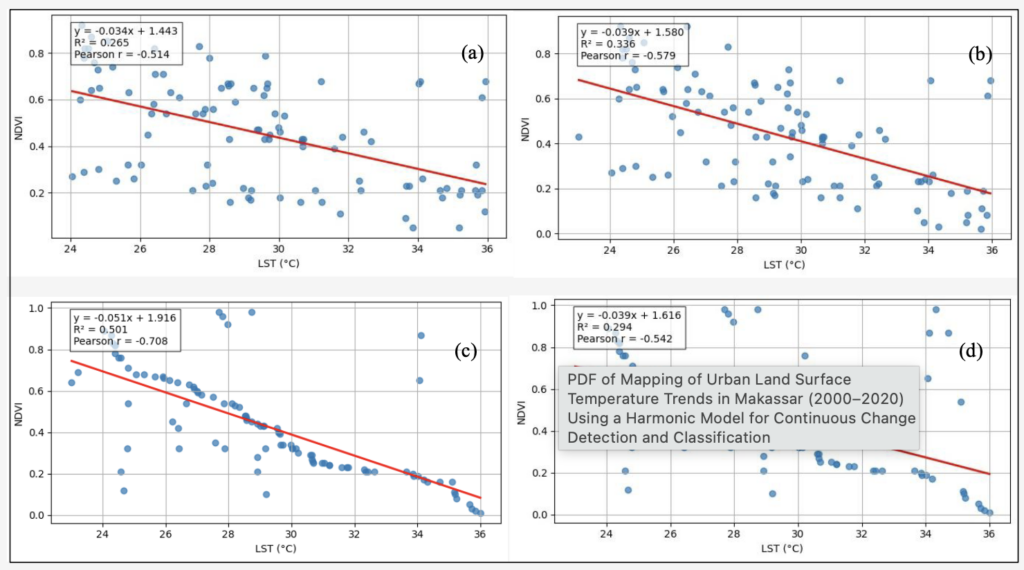
This finding connects directly to SDG 15: Life on Land, which calls for combating land degradation and restoring vegetation, including in and around cities. The study’s authors argue that this is not just an abstract climate statistic, it is a map of exactly where Makassar most urgently needs green infrastructure, such as green belts, street trees, and protected peri-urban vegetation, concentrated along the rapidly developing northern and eastern corridors identified by the research.
As Indonesian cities continue growing, this kind of pixel-level, year-by-year monitoring offers planners something rare: an early warning system for urban heat, built entirely from free satellite data, that can flag which neighborhoods need trees planted before the heat becomes permanent.
Reference:
DOI: https://doi.org/10.52939/ijg.v22i7.5072
Contact:
Atika Izzaty (corresponding author)
Civil Engineering Department, Universitas Hasanuddin
Email: atikaizzaty@unhas.ac.id